Fig. 4
Download original image
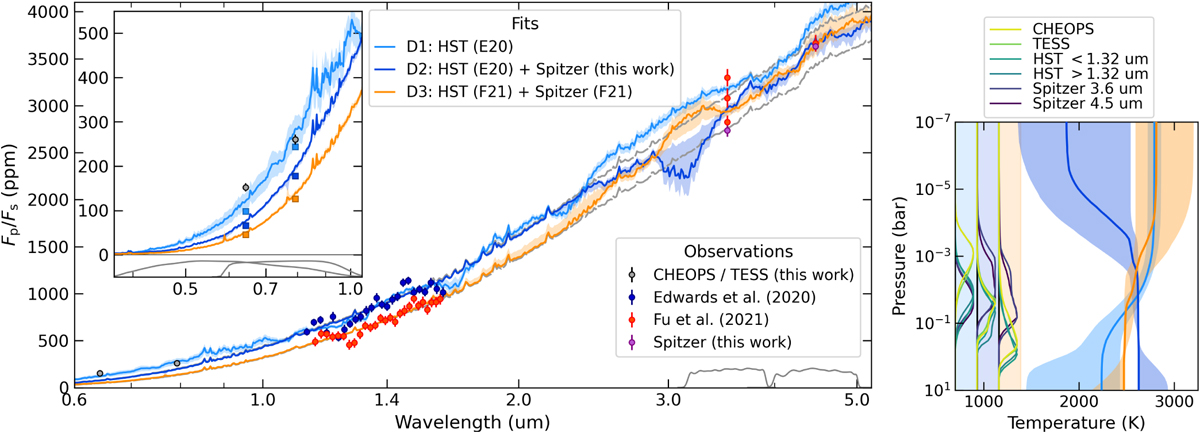
WASP-76 b occultation atmospheric retrievals. Left: light blue, dark blue, and orange curves and their associated shaded areas show the retrieved spectrum and 68% credible intervals when fitting the D1, D2, and D3 occultation observations, respectively (see legends). These retrievals include both TiO and VO opacities. The blue, red, and purple markers with error bars show the occultation depths from E20, F21, and this work, respectively. The grey markers show the CHEOPS and TESS occultation measurements, although the fits are not constrained by these observations. The dashed grey curves show spectra for two blackbody planetary models at 2480 and 2630 K (matching the HST observations). The grey curves at the bottom show the throughputs for the photometric bands. Inset: zoom on the CHEOPS and TESS wavelengths. The coloured square markers show the respective models integrated over these bands. Right: retrieved temperature profiles for each retrieval run (median and 68% credible interval). The curves at the left edge show the contribution functions, indicating the pressures probed by the observations. The colour code is the same as for the retrieved spectra (see legends).
Current usage metrics show cumulative count of Article Views (full-text article views including HTML views, PDF and ePub downloads, according to the available data) and Abstracts Views on Vision4Press platform.
Data correspond to usage on the plateform after 2015. The current usage metrics is available 48-96 hours after online publication and is updated daily on week days.
Initial download of the metrics may take a while.