Fig. 3
Download original image
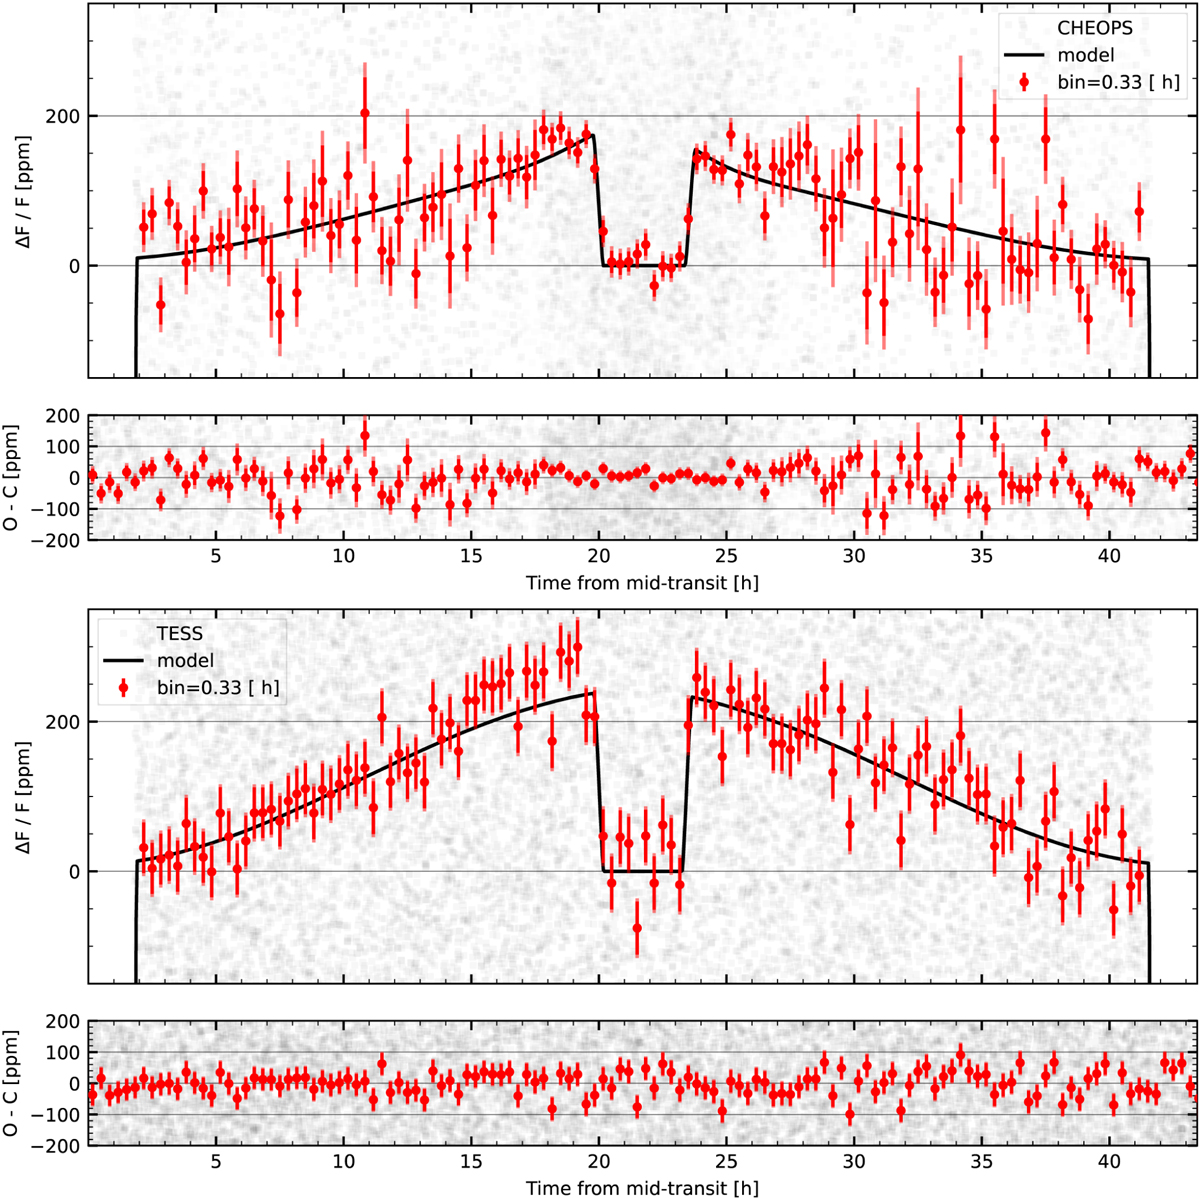
Reduced and phase-folded light-curves in CHEOPS and TESS bandpasses using the Cos+Kelp,Refl phase curve models. As in Fig. 2, the light-curves are corrected from the contamination and from modelled instrumental systematic. The zero flux level is set as the stellar flux. The grey points are the individual measurements. The red ones are their mean values within orbital phase bins regularly distributed. The solid black line represents the best model (see Sect. 4.2) using the Cos+Kelp,refl phase-curve model for CHEOPS and TESS (described in Sect. 4.1). The top two panels present the reduced phase-folded light curve of and residuals of the CHEOPS data and the bottom two panels are for the reduced phase-folded light curve of and residuals of the TESS data.
Current usage metrics show cumulative count of Article Views (full-text article views including HTML views, PDF and ePub downloads, according to the available data) and Abstracts Views on Vision4Press platform.
Data correspond to usage on the plateform after 2015. The current usage metrics is available 48-96 hours after online publication and is updated daily on week days.
Initial download of the metrics may take a while.