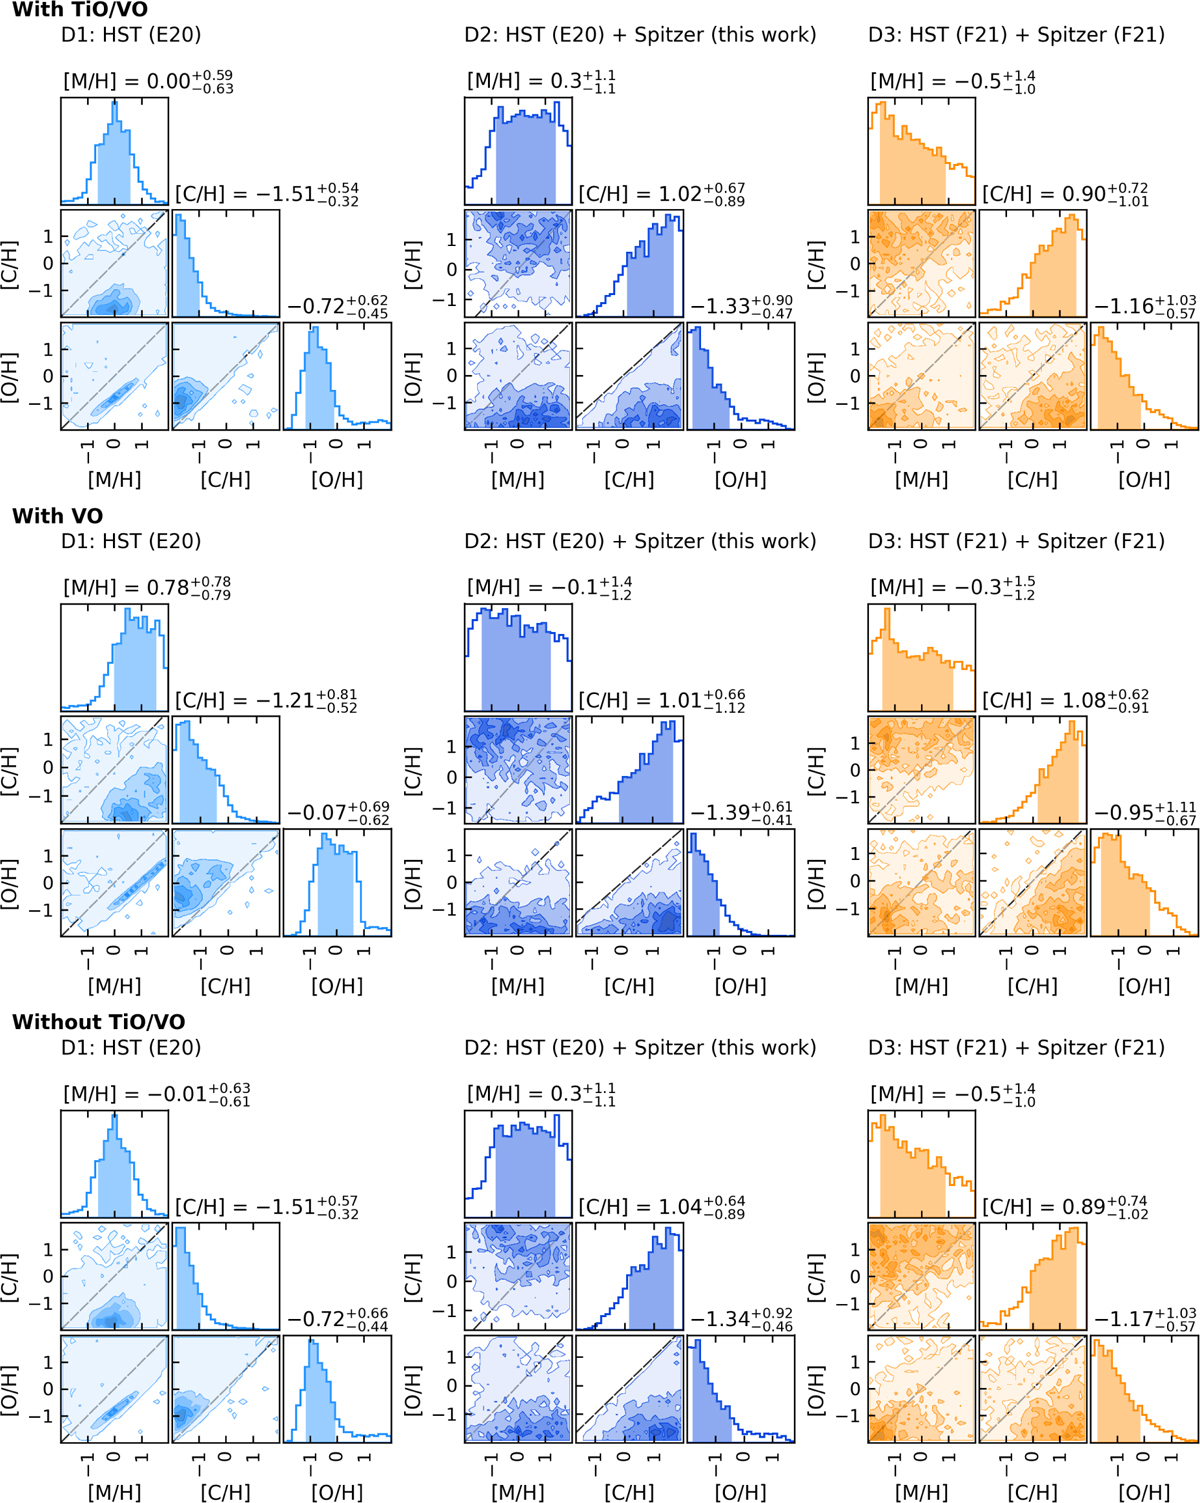
Fig. C.2
Download original image
WASP-76 b abundance parameter posterior distributions. The dashed diagonal lines in the pair-wise panels mark boundary when both variables have the same metallicity enhancement (with respect to solar values). The values at the top of each histogram panel report the median and boundaries of the central 68% credible interval for each marginal posterior. The shaded area in the histogram panels denote the span of these credible intervals. The black curves at the left edges show the contribution functions over the CHEOPS, TESS, HST, and Spitzer bands.
Current usage metrics show cumulative count of Article Views (full-text article views including HTML views, PDF and ePub downloads, according to the available data) and Abstracts Views on Vision4Press platform.
Data correspond to usage on the plateform after 2015. The current usage metrics is available 48-96 hours after online publication and is updated daily on week days.
Initial download of the metrics may take a while.