Fig. 1
Download original image
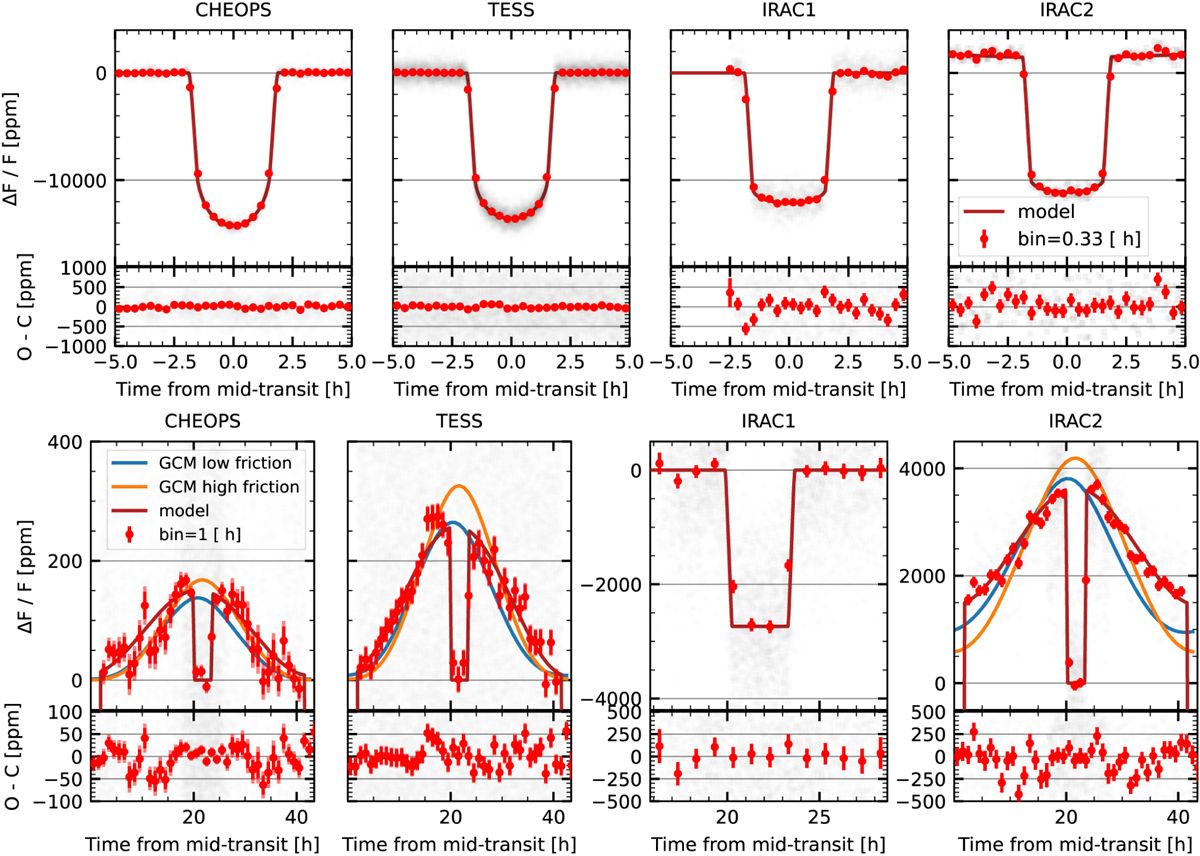
Reduced and phase-folded light-curves in CHEOPS, TESS, Spitzer-IRAC1 and Spitzer-IRAC2 bandpasses: The light-curves are corrected from the contamination and from modelled instrumental systematic. The zero flux level is set as the stellar flux, except for the Spitzer-IRAC1 data where, in the absence of a reliable PC, we set the out-of-transit and the out-of-eclipse flux level to zero. Here, we only show the data acquired around occultations. The grey points are the individual measurements. The red ones are their mean values within orbital phase bins regularly distributed. The solid red line represents the best model (see Sect. 4.2) using the cosine phase-curve model (described in Sect. 4.1). The solid blue and orange lines represent the two GCM models with low and high friction (see Sect. 5.2.2). Top: light curves displayed focusing on the transit. Bottom: focus on the PCs.
Current usage metrics show cumulative count of Article Views (full-text article views including HTML views, PDF and ePub downloads, according to the available data) and Abstracts Views on Vision4Press platform.
Data correspond to usage on the plateform after 2015. The current usage metrics is available 48-96 hours after online publication and is updated daily on week days.
Initial download of the metrics may take a while.