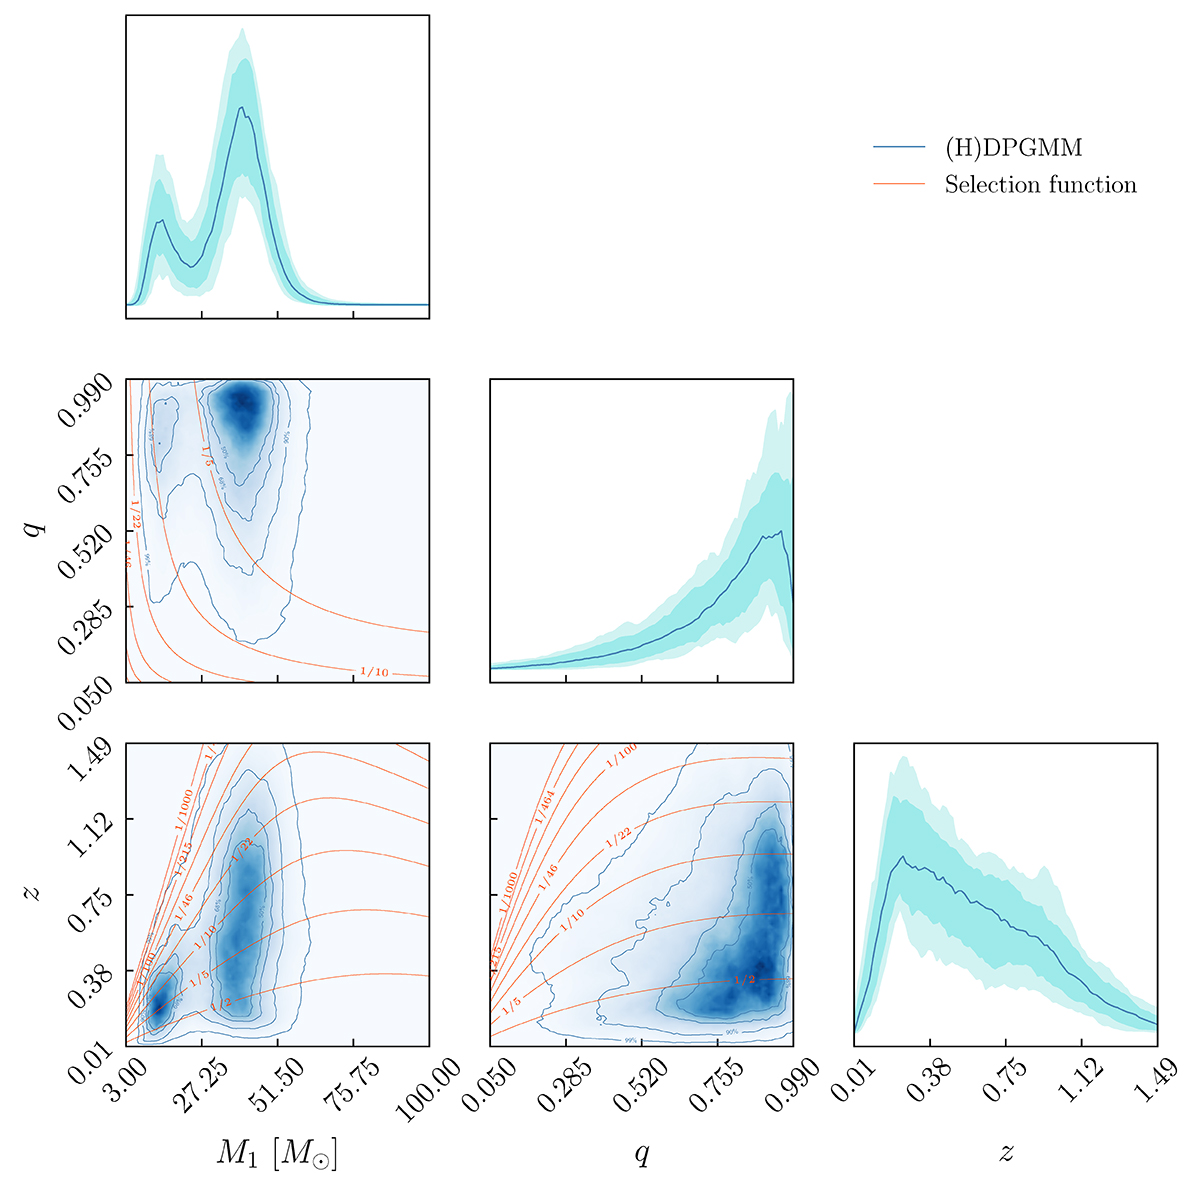
Fig. D.1.
Download original image
Observed distribution for the simulated catalogue reconstructed with FIGARO (blue line) along with the iso-probability levels of the selection function (red). The diagonal panels show the marginal distributions for M1, q and z (top to bottom) respectively and the panels below diagonal show the median distribution marginalised over the third variable.
Current usage metrics show cumulative count of Article Views (full-text article views including HTML views, PDF and ePub downloads, according to the available data) and Abstracts Views on Vision4Press platform.
Data correspond to usage on the plateform after 2015. The current usage metrics is available 48-96 hours after online publication and is updated daily on week days.
Initial download of the metrics may take a while.