Fig. 1
Download original image
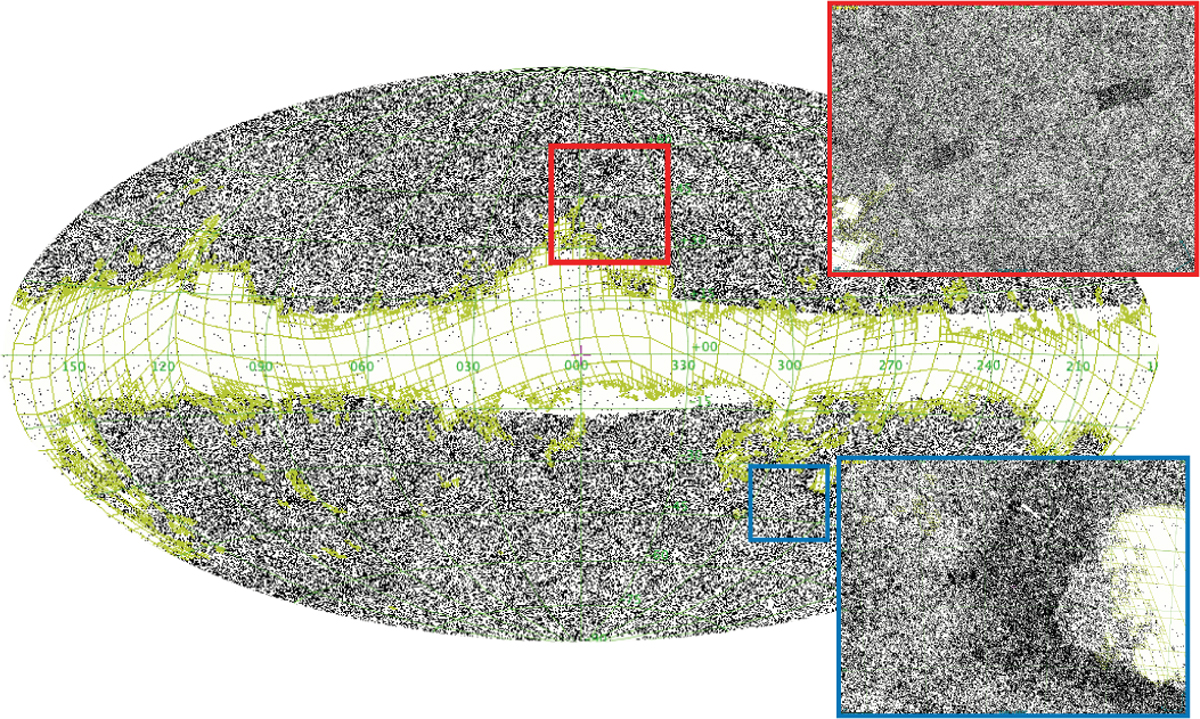
Galaxy distribution of the GLADE+ catalogue superimposed on the MOC maps (green) derived from the reddening map by Schlegel et al. (1998), presented within the galactic frame using a Mollweide projection. The MOC contour has an extinction value >0.2 with an area = 10481 deg2. The red and blue boxes are zooms showing two examples of anisotropies in the galaxy distribution, possibly due to surveys with different sensitivities covering the region.
Current usage metrics show cumulative count of Article Views (full-text article views including HTML views, PDF and ePub downloads, according to the available data) and Abstracts Views on Vision4Press platform.
Data correspond to usage on the plateform after 2015. The current usage metrics is available 48-96 hours after online publication and is updated daily on week days.
Initial download of the metrics may take a while.