Fig. 8.
Download original image
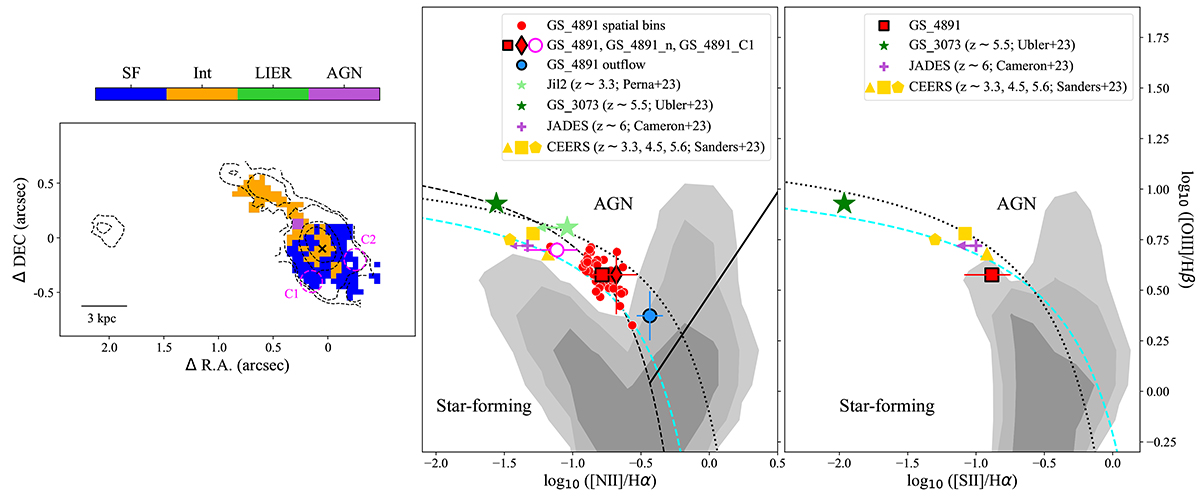
Left: map of excitation mechanisms throughout GS_4891 and GS_4891_n according to the location in the [N II]-based BPT diagnostic diagram. The dashed black contours correspond to the Hα emission, whereas the black cross indicates the centroid of continuum emission. Centre and right: [N II]- and [S II]-based BPT diagrams containing the spatially binned regions (red dots), the integrated regions of the system where the relevant lines are detected with S/N ≥ 3 (red square and diamond, and pink circle), and the broad kinematic component associated with the ionised outflow identified in GS_4891 (blue circle). Clump C2 is not shown in any of the diagrams due to the low S/N in Hβ and [N II]. As a reference, we have added the stack of galaxies at z ∼ 6 from Cameron et al. (2023, purple plus), the stacks in different high-redshift bins from Sanders et al. (2023, yellow symbols), the obscured AGN at z ∼ 3.3, “Jil2”, from Perna et al. (2023, lightgreen star), and the broad-line AGN, GS_3073, at z ∼ 5.5 studied in Übler et al. (2023, darkgreen star). The shaded grey contours demarcate the regions in the diagram encompassed by 70, 80, and 90% of the local SDSS sample (Abazajian et al. 2009). Dashed (Kauffmann et al. 2003) and dotted black lines (Kewley et al. 2001) demarcate the separation between ionisation coming from star formation and AGN activity based on studies of local galaxies (see Sect. 3.2.3 for details). The cyan lines correspond to the best-fit curves to the star-forming population at z ∼ 2.3 from Strom et al. (2017).
Current usage metrics show cumulative count of Article Views (full-text article views including HTML views, PDF and ePub downloads, according to the available data) and Abstracts Views on Vision4Press platform.
Data correspond to usage on the plateform after 2015. The current usage metrics is available 48-96 hours after online publication and is updated daily on week days.
Initial download of the metrics may take a while.