Fig. 3.
Download original image
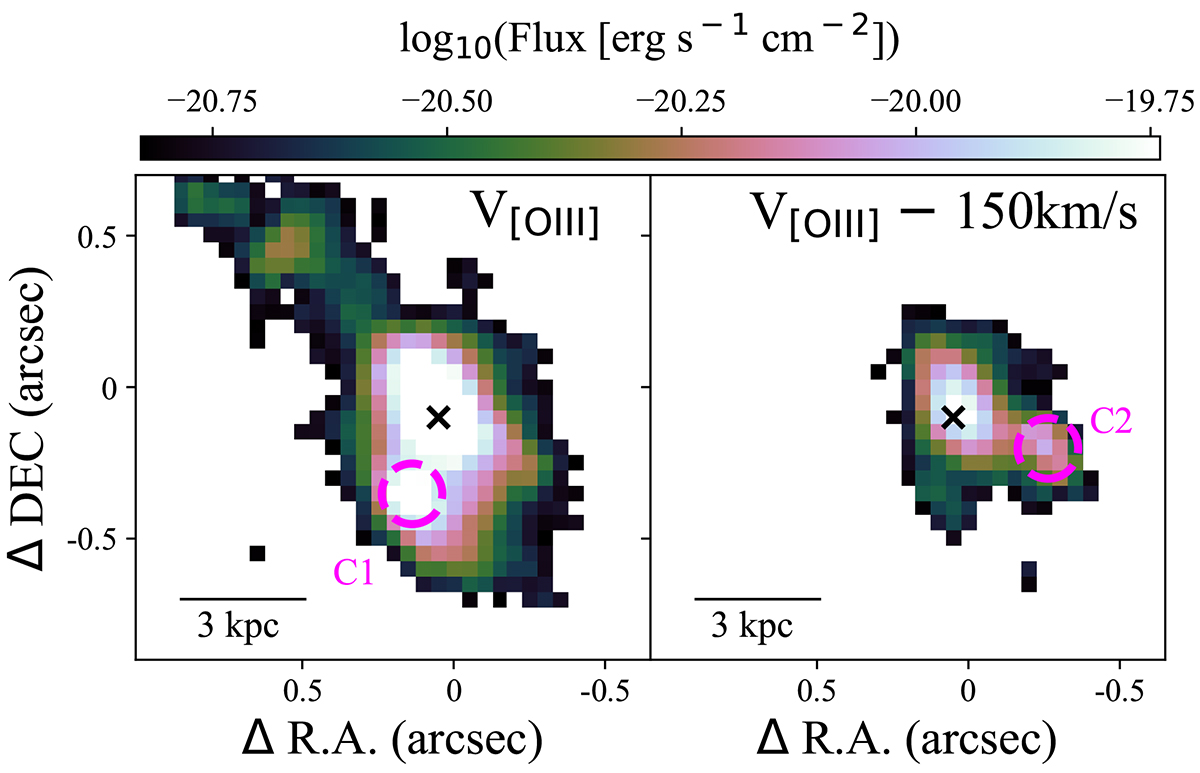
Flux maps in windows of two spectral pixels (∼50 km s−1 wide) centred at 25 km s−1 and −170 km s−1 with respect to the position of [O III] λ5007 at the systemic redshift (z = 3.7027) where the C1 and C2 separate clumps (magenta circles) are identified. The origin of the coordinates corresponds to RA 3h32m18.29s, Dec −27°51′59.17″, J2000. North is up and east is to the left.
Current usage metrics show cumulative count of Article Views (full-text article views including HTML views, PDF and ePub downloads, according to the available data) and Abstracts Views on Vision4Press platform.
Data correspond to usage on the plateform after 2015. The current usage metrics is available 48-96 hours after online publication and is updated daily on week days.
Initial download of the metrics may take a while.