Fig. A.1.
Download original image
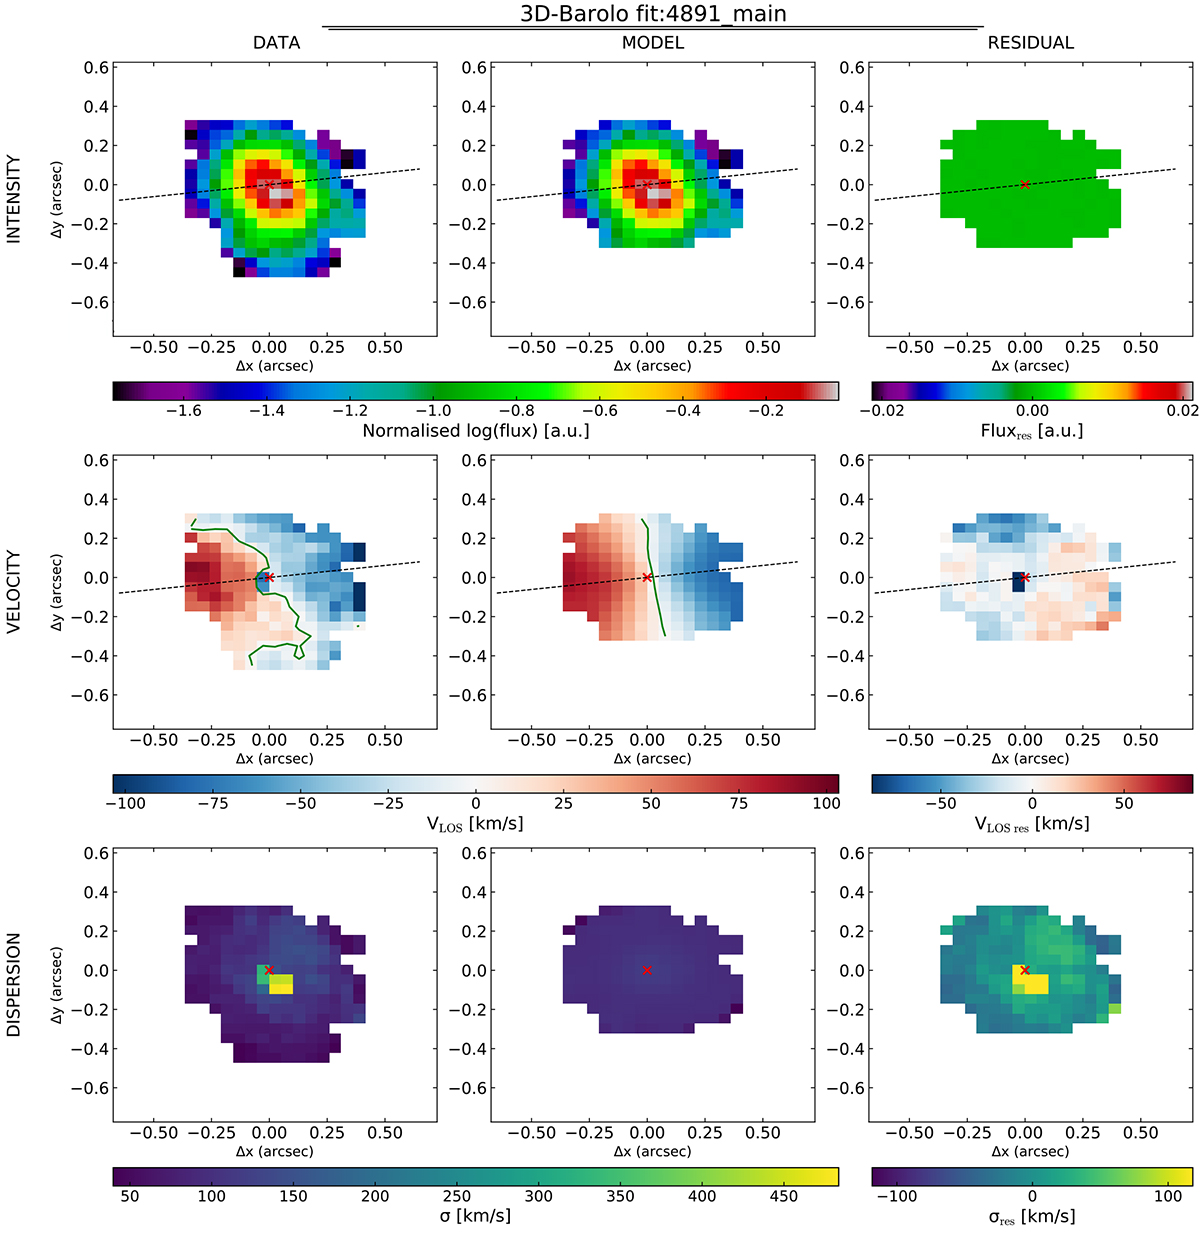
Disc kinematic best-fit of the total flux, velocity, and velocity dispersion of GS_4891 (first to third rows). The analysis was performed with 3D-BAROLO (Di Teodoro & Fraternali 2015) on the kinematics maps obtained from a spaxel-by-spaxel emission-line fitting (see Section 3.3 and Figure 11). The black and green lines identify the major axis and the zero-velocity curve, respectively.
Current usage metrics show cumulative count of Article Views (full-text article views including HTML views, PDF and ePub downloads, according to the available data) and Abstracts Views on Vision4Press platform.
Data correspond to usage on the plateform after 2015. The current usage metrics is available 48-96 hours after online publication and is updated daily on week days.
Initial download of the metrics may take a while.