Open Access
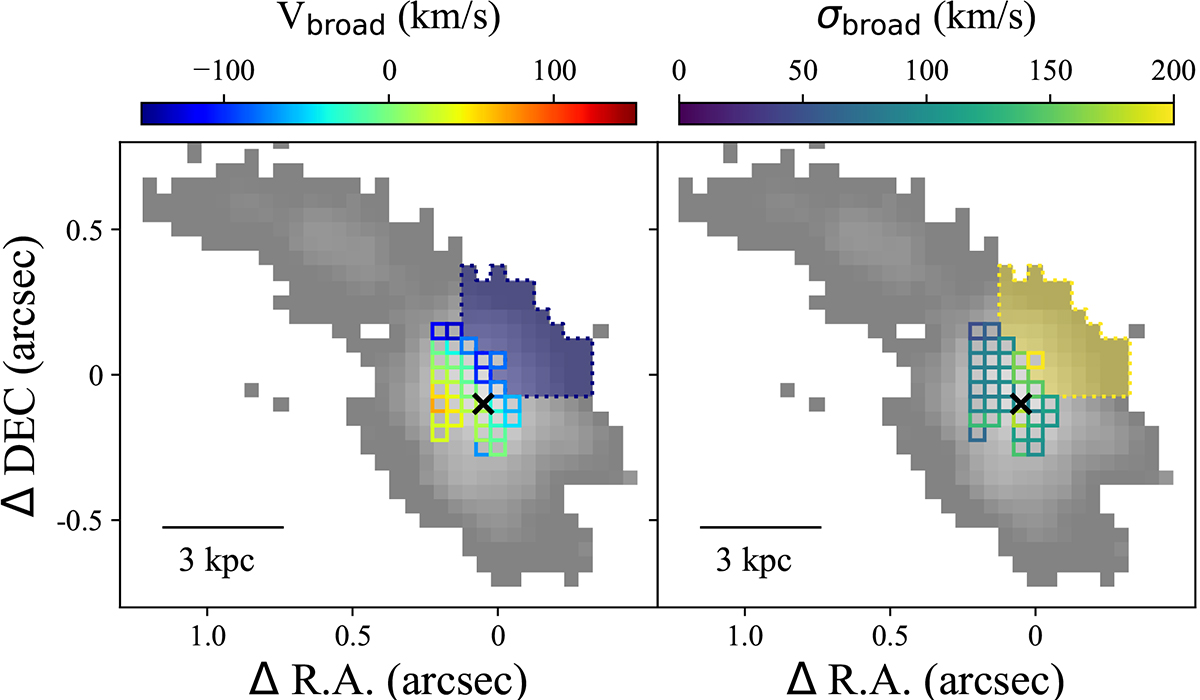
Fig. 12.
Download original image
Velocity and velocity dispersion maps of the broad kinematic component superimposed on the Hα flux distribution in GS_4891 (grey background). The black cross indicates the centroid of continuum emission.
Current usage metrics show cumulative count of Article Views (full-text article views including HTML views, PDF and ePub downloads, according to the available data) and Abstracts Views on Vision4Press platform.
Data correspond to usage on the plateform after 2015. The current usage metrics is available 48-96 hours after online publication and is updated daily on week days.
Initial download of the metrics may take a while.