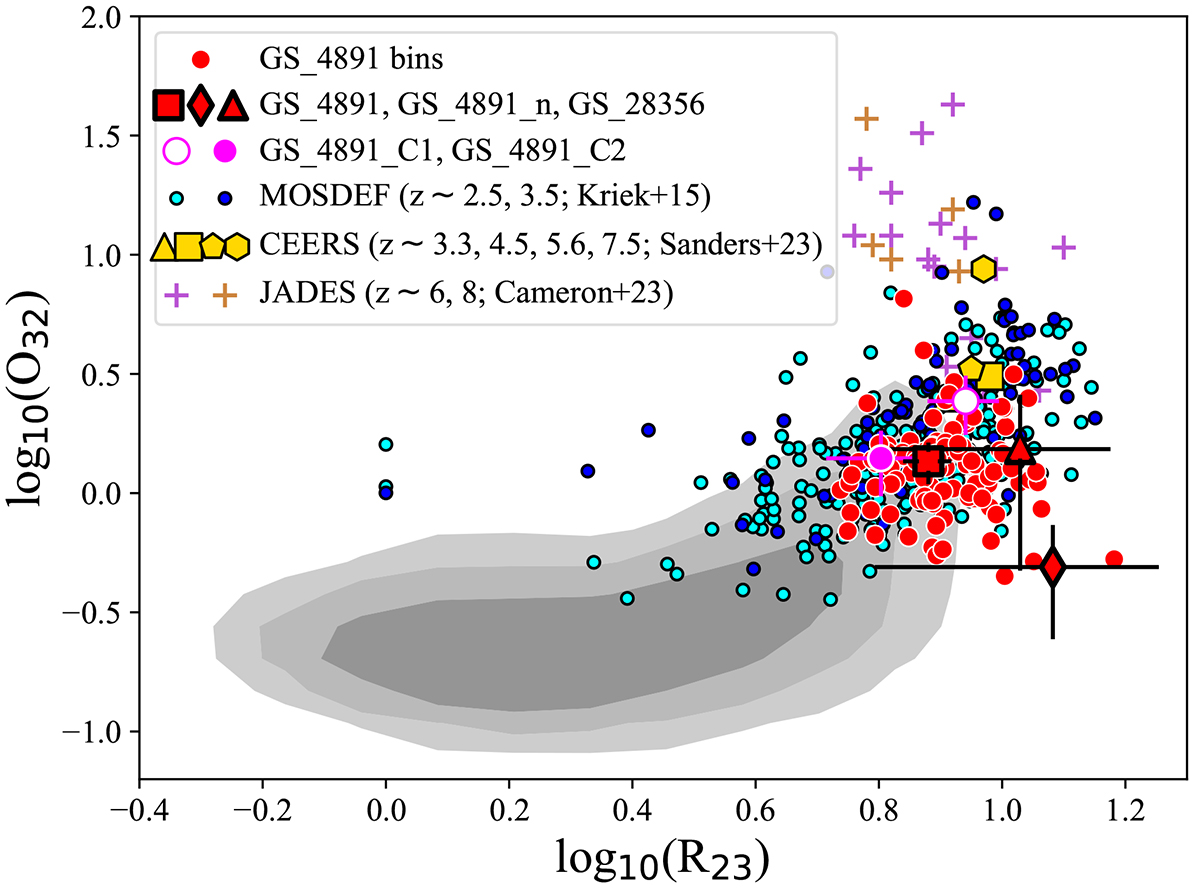
Fig. 10.
Download original image
R23−O32 diagram for the GS_4891 system in comparison with other works. Spatially binned regions are shown as red dots, whereas integrated values are shown as red polygons and empty and filled magenta circles. As a reference, we have added the stacks of galaxies at z ∼ 2.5, 3.5 from Kriek et al. (2015, light and dark blue points, respectively), the stacks in different redshift bins from Sanders et al. (2023, yellow symbols), and the individual galaxies at z ∼ 6, 8 from Cameron et al. (2023, purple and brown pluses, respectively). Shaded contours demarcate the regions in the diagram encompassed by 70, 80, and 90% of the local SDSS sample (Abazajian et al. 2009).
Current usage metrics show cumulative count of Article Views (full-text article views including HTML views, PDF and ePub downloads, according to the available data) and Abstracts Views on Vision4Press platform.
Data correspond to usage on the plateform after 2015. The current usage metrics is available 48-96 hours after online publication and is updated daily on week days.
Initial download of the metrics may take a while.