Fig. 2
Download original image
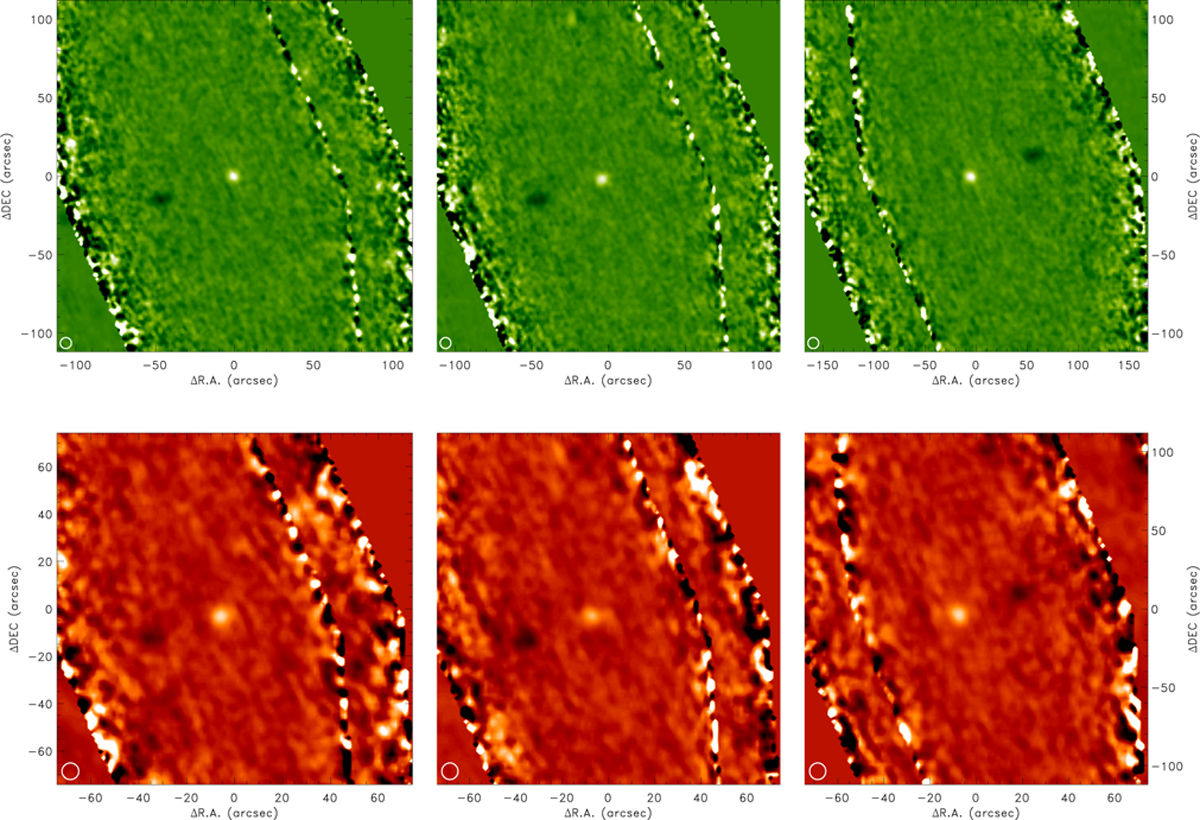
Example images of the Herschel/PACS light curve data. The 100 µm (top row) and 160 µm (bottom row) LCDIFF images with the OBSΓDs and starting repetitions 134229967/001, 13422230111/001, and 13422230111/076 are shown. The photometry was performed on the bright source at the centre of the image. The dark spot in each panel is the image of Quaoar on the respective background image. In all images the colours are drawn from −3σ (black) and +3σ (white). The black and white stripes are the edges of the single scan maps. The coverage is significantly lower, and therefore the noise is higher towards the edges than in the centre.
Current usage metrics show cumulative count of Article Views (full-text article views including HTML views, PDF and ePub downloads, according to the available data) and Abstracts Views on Vision4Press platform.
Data correspond to usage on the plateform after 2015. The current usage metrics is available 48-96 hours after online publication and is updated daily on week days.
Initial download of the metrics may take a while.