Fig. 9.
Download original image
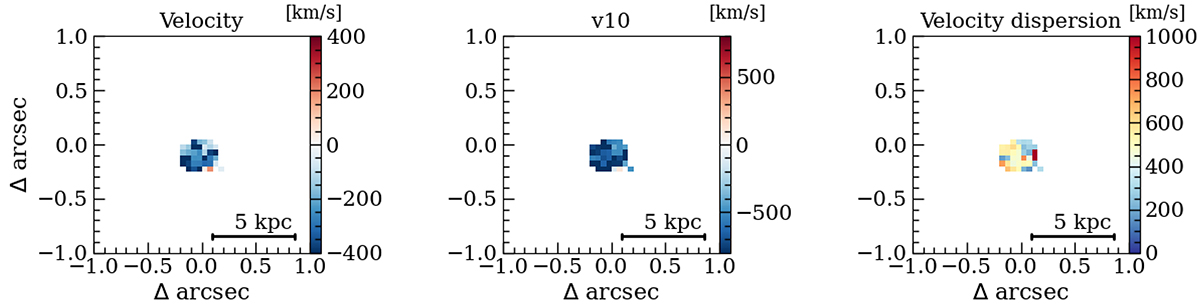
Spatially resolved kinematic maps for the outflow component. From left to right, the velocity map of the outflow component, the v10 that corresponds to the velocity at which the outflow component is at the 10th percentile, and the velocity dispersion map of the outflow, respectively. Zero velocity corresponds to the velocity of the narrow line.
Current usage metrics show cumulative count of Article Views (full-text article views including HTML views, PDF and ePub downloads, according to the available data) and Abstracts Views on Vision4Press platform.
Data correspond to usage on the plateform after 2015. The current usage metrics is available 48-96 hours after online publication and is updated daily on week days.
Initial download of the metrics may take a while.