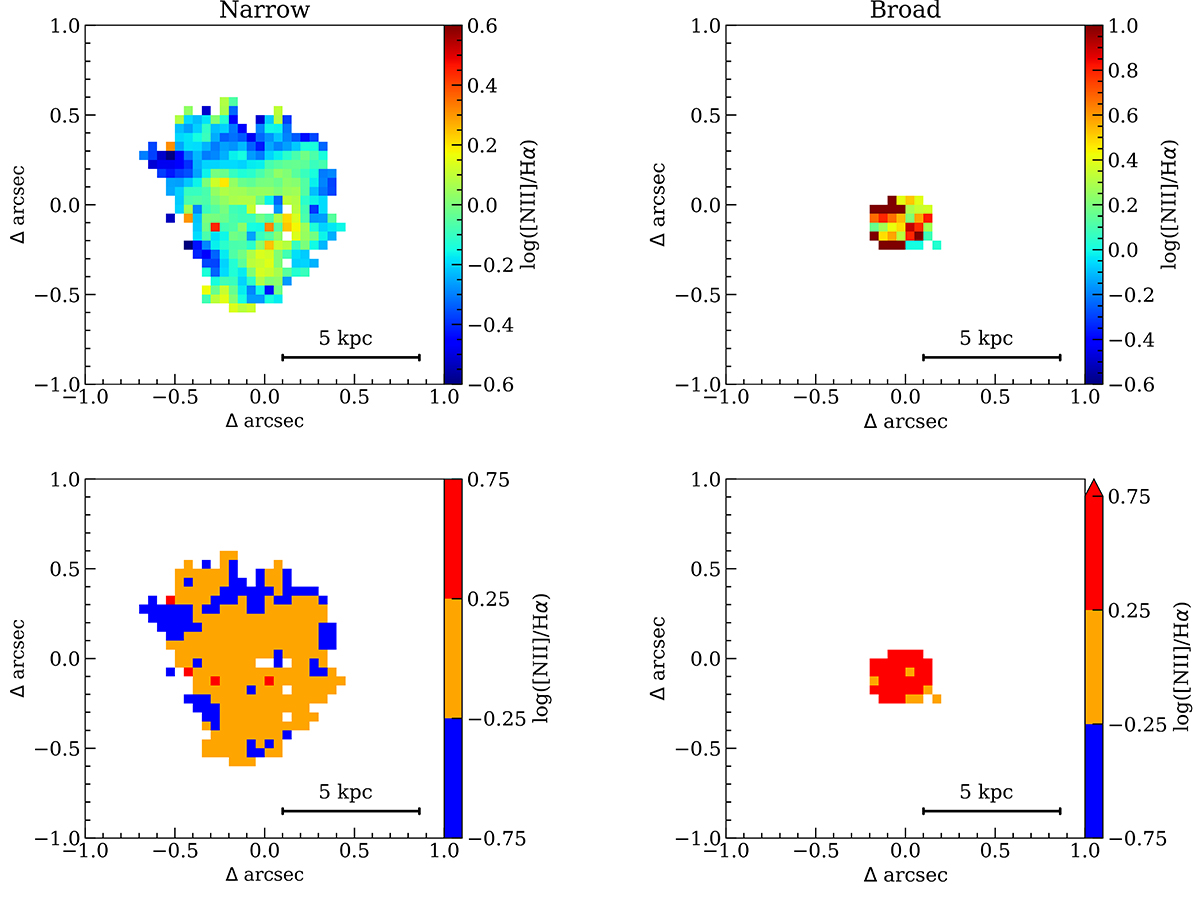
Fig. 7.
Download original image
Resolved BPT diagram for ALESS073.1 host galaxy (narrow) and outflow (broad) component. Upper panels: spatially resolved map of the observed values of log([N II]/Hα) for the narrow and broad components from left to right, respectively. Lower panels: the spatially resolved BPT where every spaxel in the galaxy is color-coded according to its value of log([N II]/Hα) for the narrow and broad components, from left to right, respectively, as in the histogram in the upper right panel.
Current usage metrics show cumulative count of Article Views (full-text article views including HTML views, PDF and ePub downloads, according to the available data) and Abstracts Views on Vision4Press platform.
Data correspond to usage on the plateform after 2015. The current usage metrics is available 48-96 hours after online publication and is updated daily on week days.
Initial download of the metrics may take a while.