Fig. 6.
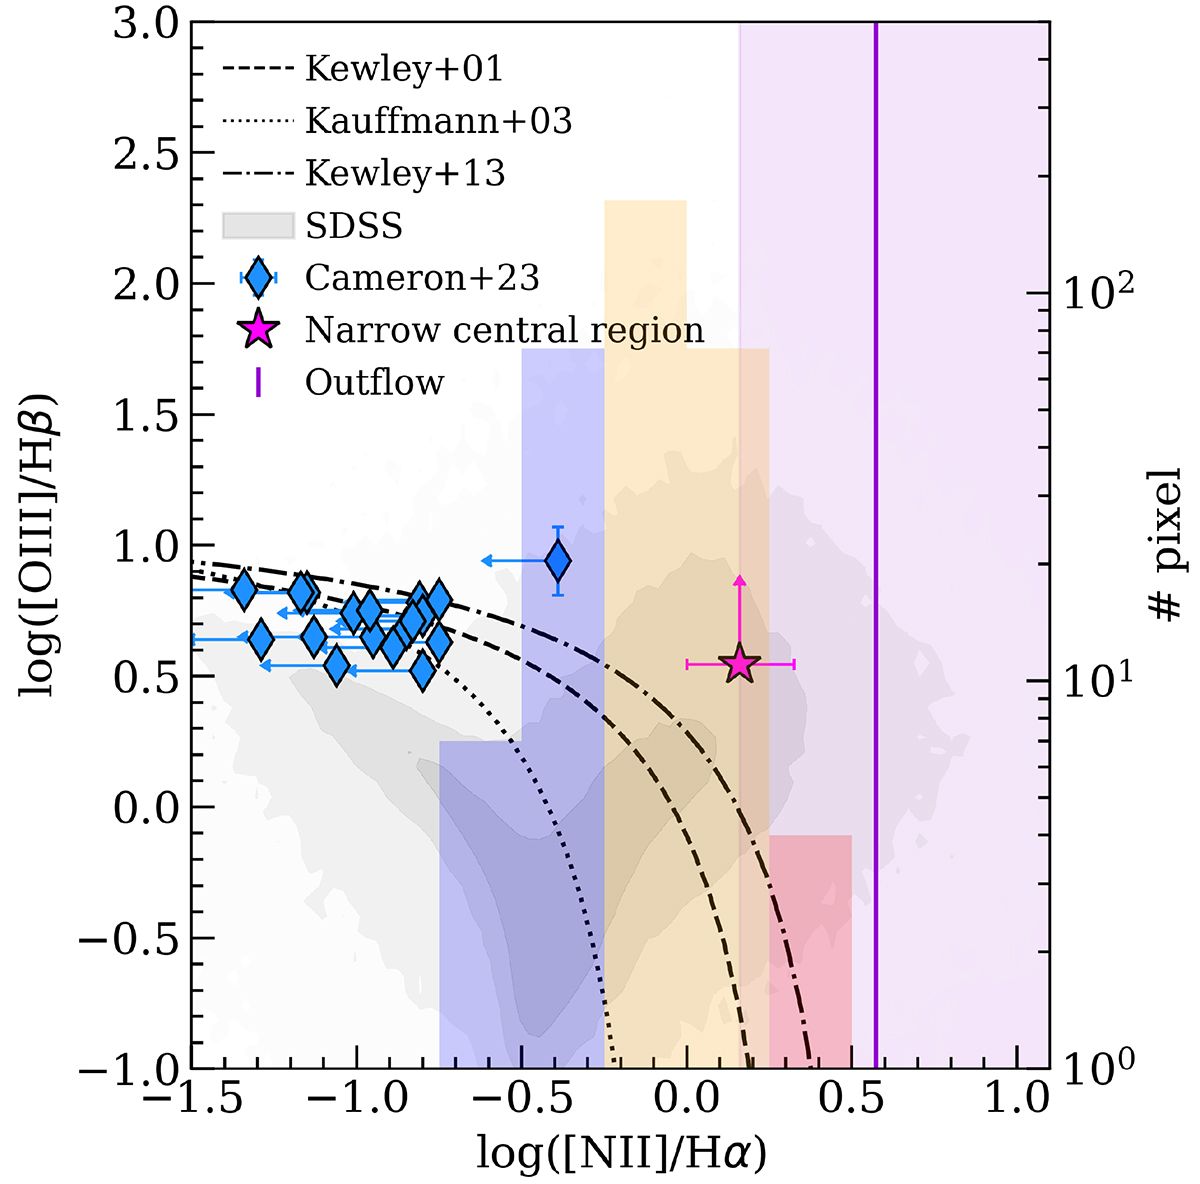
Download original image
BPT diagram of the target. The star marker in magenta shows the position of the central spaxels of ALESS073.1 in the BPT diagram for the narrow component. The position of the outflow component based only on the log([N II]/Hα) detection is reported as a purple vertical line and the error associated with it is reported as the purples-shaded area. The dashed and the dotted lines are the predictions from Kewley et al. (2001) and Kauffmann et al. (2003), respectively, for the separation between star-forming (below) and AGN (above) dominated regions at z = 0. The dash-dotted line is the theoretical redshift evolution of the separation curve for galaxies at z = 3 by Kewley et al. (2013). The gray shaded area represents the position in the BPT of SDSS galaxies at z ∼ 0. Blue diamonds are the results from Cameron et al. (2023) for high-redshift (z > 5) galaxies. Overplotted with the BPT diagram we report the histogram representing the number of spaxels of the narrow component as a function of log([N II]/Hα).
Current usage metrics show cumulative count of Article Views (full-text article views including HTML views, PDF and ePub downloads, according to the available data) and Abstracts Views on Vision4Press platform.
Data correspond to usage on the plateform after 2015. The current usage metrics is available 48-96 hours after online publication and is updated daily on week days.
Initial download of the metrics may take a while.