Fig. 5.
Download original image
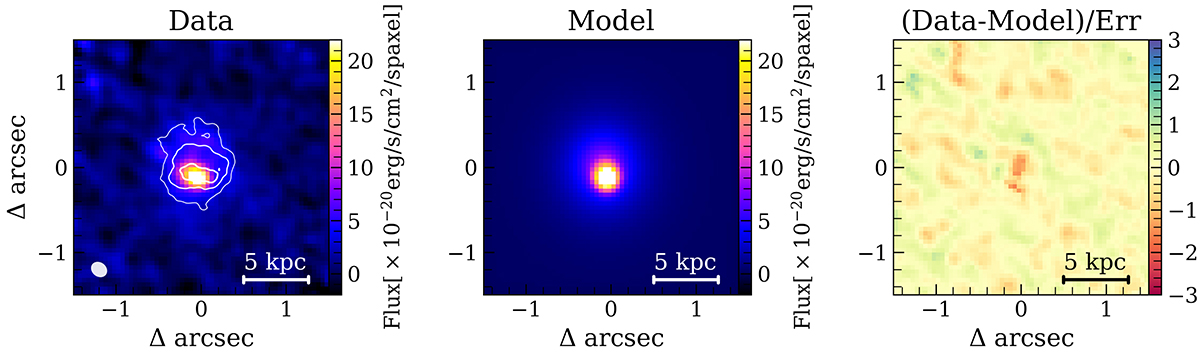
Observed Hα flux map, best-fitting model, and residuals, from left to right, respectively. In the left panel, we show the Hα flux, overlaid with the [C II] contours at 3, 6, and 9σ. The two maps were aligned by centering them on the brightest spaxel. The gray ellipse represents the PSF size and shape. In the central panel, we show the best-fit model composed by the sum of a 2D Gaussian component that includes all the unresolved or marginally resolved components (BLR, outflow, bulge) and a 2D Sérsic component with the Sérsic index n = 1 that represent the galactic disk. In the right panel, we show the residuals, calculated as the observed flux minus the model, divided by the error. The color bar stretches between −3σ and +3σ.
Current usage metrics show cumulative count of Article Views (full-text article views including HTML views, PDF and ePub downloads, according to the available data) and Abstracts Views on Vision4Press platform.
Data correspond to usage on the plateform after 2015. The current usage metrics is available 48-96 hours after online publication and is updated daily on week days.
Initial download of the metrics may take a while.