Fig. 4.
Download original image
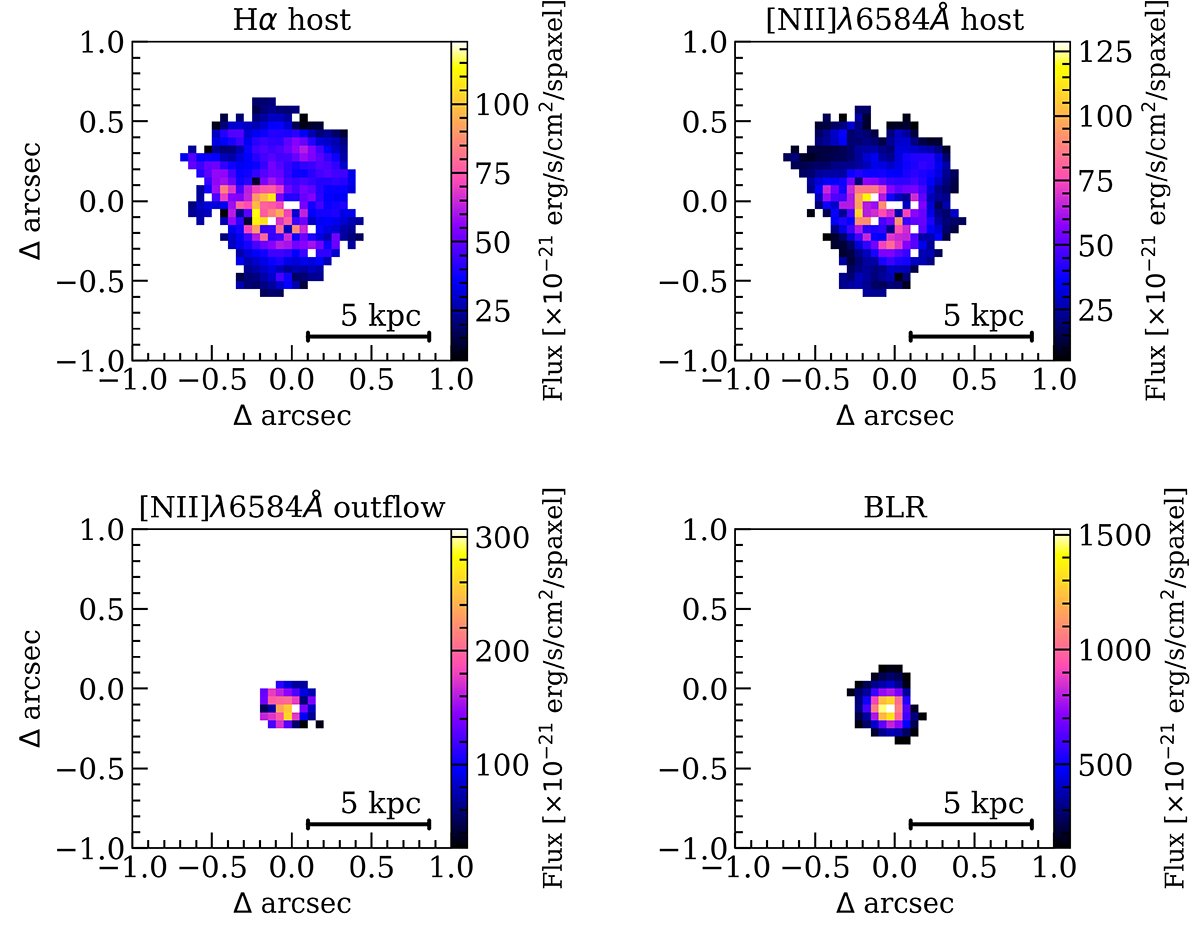
Flux maps created from the results of the spaxel-by-spaxel multi-Gaussian fitting. Upper row: the flux of the Hα and [N II]λ6584 Å narrow components representing the host galaxy emission from left to right, respectively. Bottom left panel: the flux of the outflow component traced by the [N II]λ6584 Å broader component. Bottom right panel: the broad Hα component that traces the emission from the BLR. The x and y axes are the displacement in arcseconds from the galaxy center at RA = 03:32:29.3, Dec = −27:56:19.6.
Current usage metrics show cumulative count of Article Views (full-text article views including HTML views, PDF and ePub downloads, according to the available data) and Abstracts Views on Vision4Press platform.
Data correspond to usage on the plateform after 2015. The current usage metrics is available 48-96 hours after online publication and is updated daily on week days.
Initial download of the metrics may take a while.