Fig. 2.
Download original image
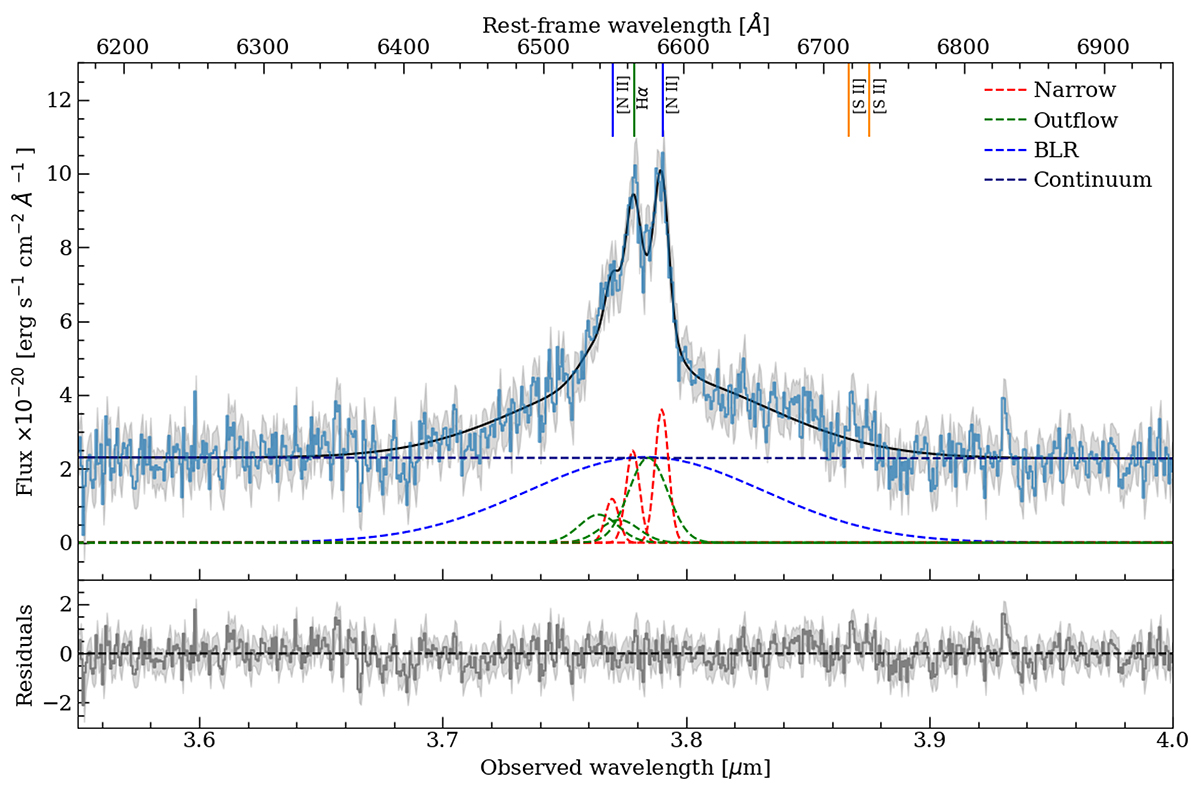
Spectrum in the central region from the G395H/F290LP cube. In the upper panel, we report in blue the spectrum extracted from a circular aperture of radius 0.15″ centered in the central region with the associated error (gray-shaded region). We show the wavelengths around the Hα complex. The solid black line is the best-fit model resulting in the sum of the dashed lines. Each dashed line represents the best-fit result of each Gaussian component or the best-fit continuum emission. In red, the emission lines associated with the narrow component tracing the host-galaxy, in green the broader component tracing the outflow, in blue the BLR, and in dark blue the best-fit polynomial continuum. The solid vertical lines on the top represent the expected position of the [N II] Hα and [S II] lines. In the lower panel, we report in as a solid gray line the residuals of the fit and as a gray-shaded region the errors associated with the data.
Current usage metrics show cumulative count of Article Views (full-text article views including HTML views, PDF and ePub downloads, according to the available data) and Abstracts Views on Vision4Press platform.
Data correspond to usage on the plateform after 2015. The current usage metrics is available 48-96 hours after online publication and is updated daily on week days.
Initial download of the metrics may take a while.