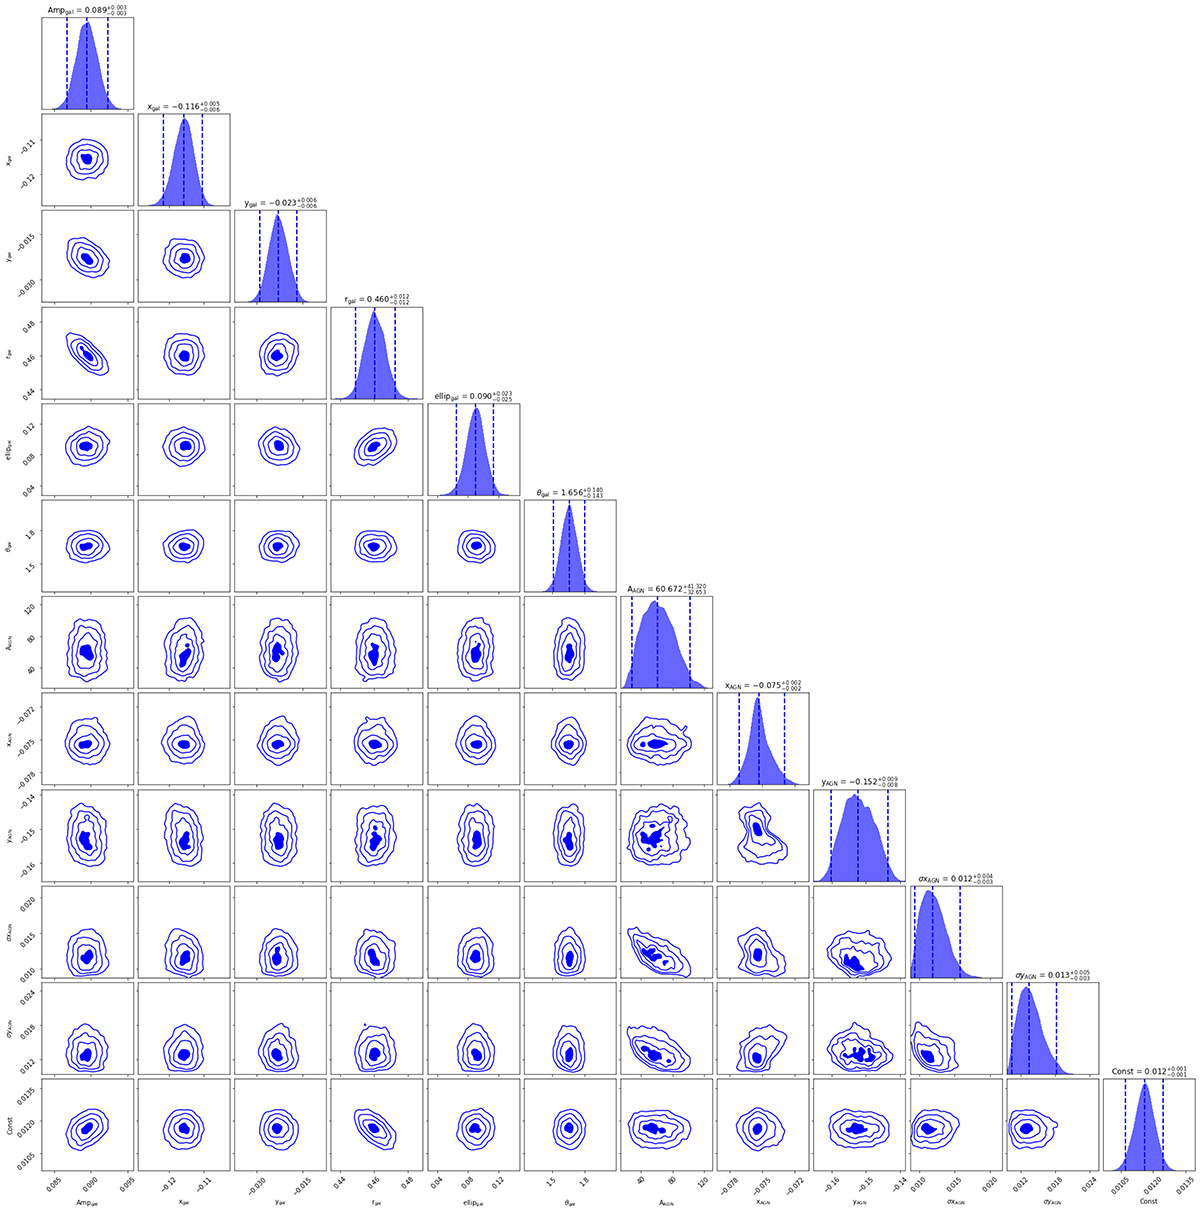
Fig. C.1.
Download original image
Posterior distribution for the free parameters in the fitting of the flux map. The dashed lines represent the 16th, 50th and 84th percentile. The galaxy is modeled as a 2D Sérsic profile, while the AGN is modeled as a two-dimensional Gaussian. The coordinates of the centers are expressed in arcseconds where the position (0,0) corresponds to the coordinates of RA = 03:32:29.3, Dec = -27:56:19.6. The radius of the galaxy and the standard deviation of the Gaussian component σx and σy are measured in arcseconds and θgal is the angle measured in radians between the y-axis and the semi-major axis of the galaxy.
Current usage metrics show cumulative count of Article Views (full-text article views including HTML views, PDF and ePub downloads, according to the available data) and Abstracts Views on Vision4Press platform.
Data correspond to usage on the plateform after 2015. The current usage metrics is available 48-96 hours after online publication and is updated daily on week days.
Initial download of the metrics may take a while.