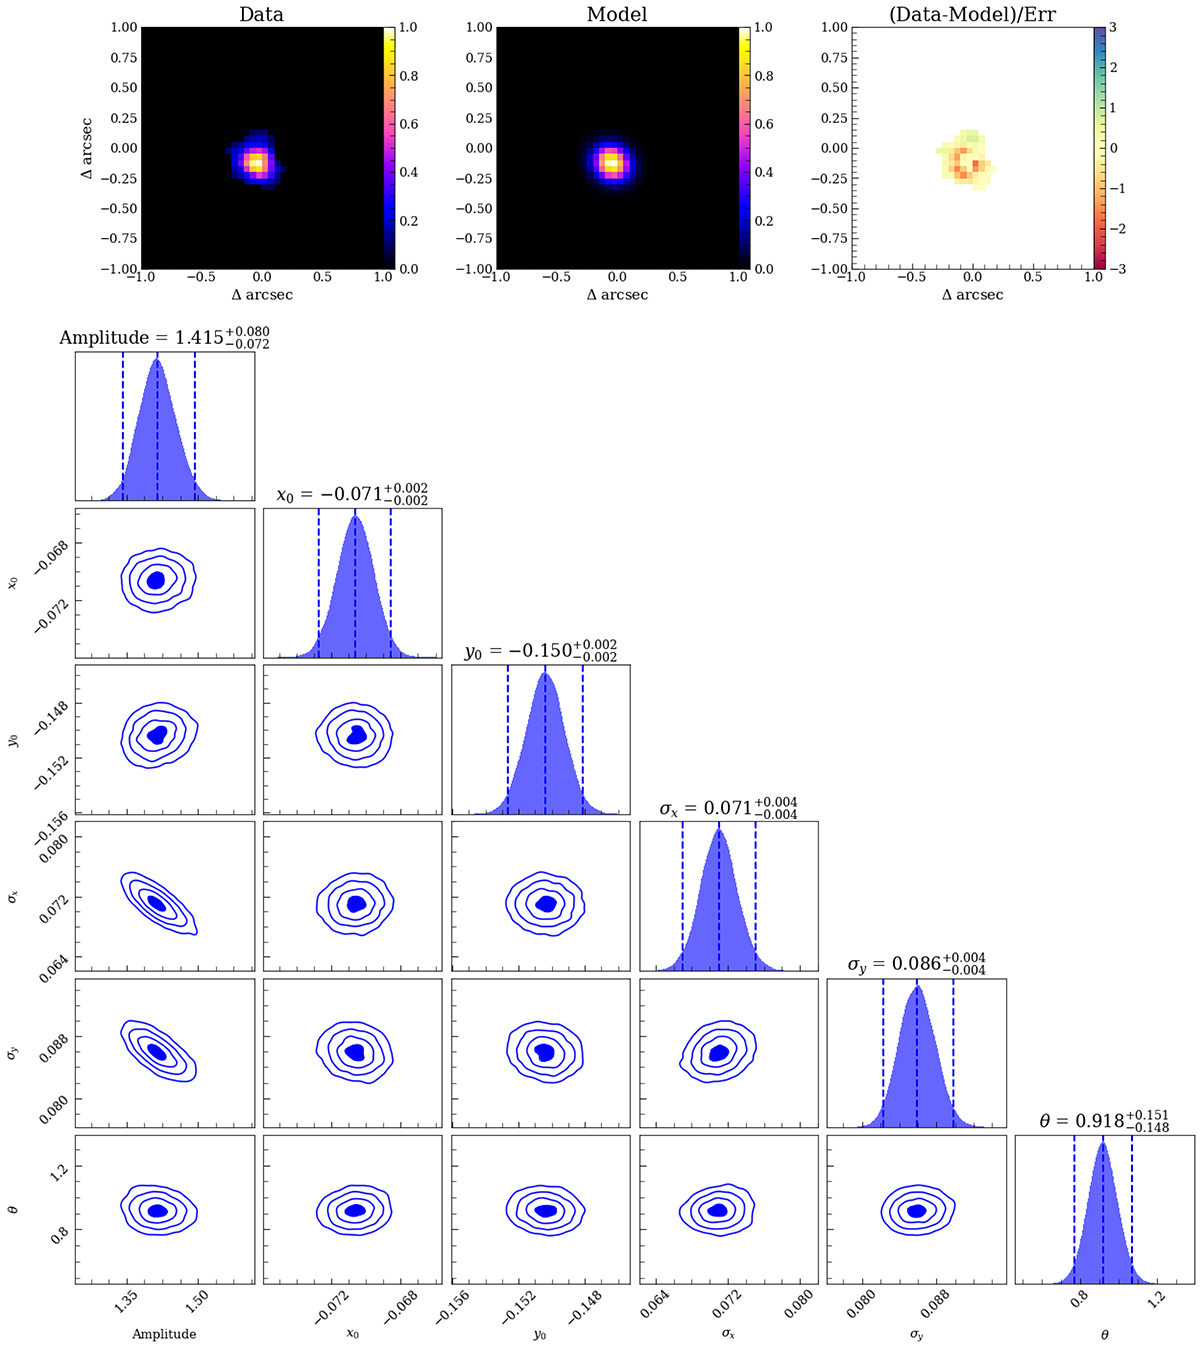
Fig. B.1.
Download original image
Results of the Gaussian fitting of the BLR to recover the observed point spread function. On the top, the BLR observed flux maps, the best-fit model, and residual from left to right. On the bottom, the corner plot reports the best-fit results and uncertainties. The amplitude is a normalization constant, x0 and y0 are the displacement in arcsec of the centroid from the galaxy center coordinates, σx and σy are the minor and major axis standard deviations in arcsec, θ is the rotation angle in radians measured counterclockwise from the positive y-axis. Above each histogram, we show the best value for each parameter and the 2σ interval.
Current usage metrics show cumulative count of Article Views (full-text article views including HTML views, PDF and ePub downloads, according to the available data) and Abstracts Views on Vision4Press platform.
Data correspond to usage on the plateform after 2015. The current usage metrics is available 48-96 hours after online publication and is updated daily on week days.
Initial download of the metrics may take a while.