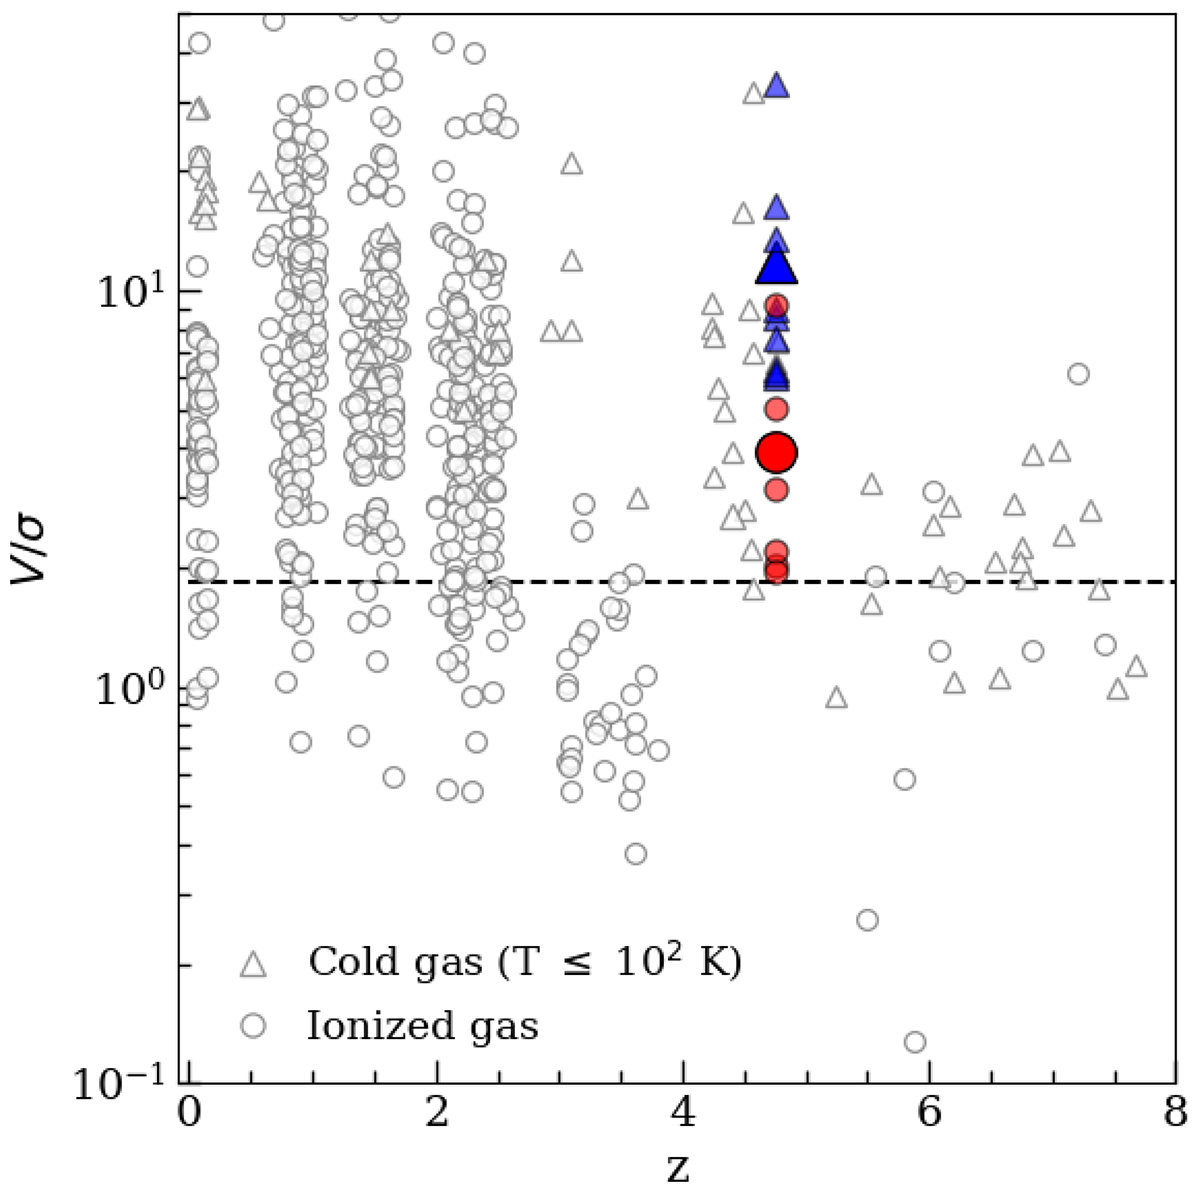
Fig. 13.
Download original image
Evolution of the ratio between the rotational velocity and the velocity dispersion with redshift. Red and blue small symbols represent the value of V/σ for each ring (see also Fig. 11) for Hα and [C II], respectively. While large symbols are the mean V/σ value across the galaxy with the two tracers. Gray symbols are other literature results, in particular, circles represent the results from kinematic studies that exploited ionized gas tracers (i.e., Hα, [O III]; Green et al. 2014; Turner et al. 2017; Förster Schreiber et al. 2018; Wisnioski et al. 2019; Parlanti et al. 2023; de Graaff et al. 2024), while triangles represent the V/σ values for galaxies studied though the molecular or neutral emission lines (i.e., [C II], CO; Rizzo et al. 2020, 2021, 2023; Fraternali et al. 2021; Jones et al. 2021; Girard et al. 2021; Lelli et al. 2021; Tsukui & Iguchi 2021). The dashed line is the demarcation between rotational supported (upper) and dispersion supported (lower).
Current usage metrics show cumulative count of Article Views (full-text article views including HTML views, PDF and ePub downloads, according to the available data) and Abstracts Views on Vision4Press platform.
Data correspond to usage on the plateform after 2015. The current usage metrics is available 48-96 hours after online publication and is updated daily on week days.
Initial download of the metrics may take a while.