Fig. C.1
Download original image
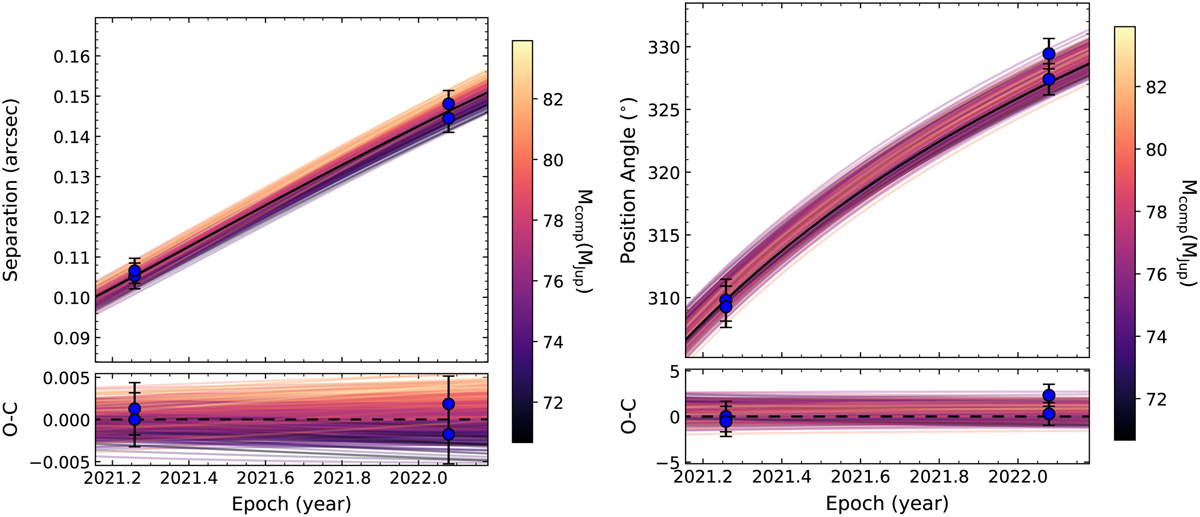
Relative separation (left) and position angle (right) of HD 112863 B as a function of time across two epochs of observations corresponding to the values in Table 2. The thick black line represents the highest likelihood orbit. The thin colored lines are 500 orbits drawn randomly from the posterior distribution. Darker purple indicates a lower companion mass, and light yellow represents a higher companion mass. The residuals of the proper motions are shown in the bottom panels.
Current usage metrics show cumulative count of Article Views (full-text article views including HTML views, PDF and ePub downloads, according to the available data) and Abstracts Views on Vision4Press platform.
Data correspond to usage on the plateform after 2015. The current usage metrics is available 48-96 hours after online publication and is updated daily on week days.
Initial download of the metrics may take a while.