Fig. E.2
Download original image
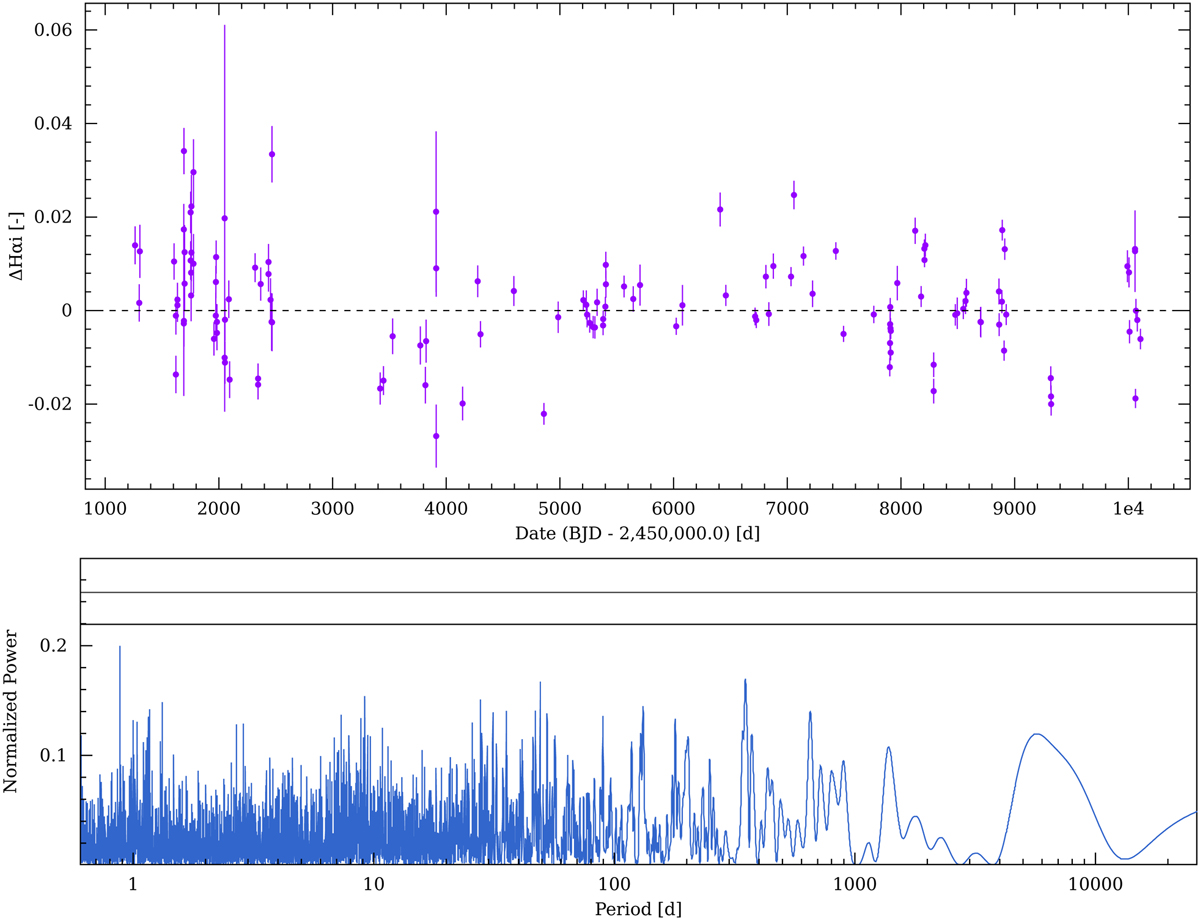
Spectroscopic analysis of HD 112863 A using the Hα chromospheric index. Top: Measured Hα chromospheric index of the host star HD 112863 as a function of time. Bottom: Corresponding Lomb-Scargle periodogram. The two black horizontal lines show the 1% (bottom) and the 0.1% (top) FAPs and demonstrate that there are no significant periodic signals in the Hα chromospheric indicator.
Current usage metrics show cumulative count of Article Views (full-text article views including HTML views, PDF and ePub downloads, according to the available data) and Abstracts Views on Vision4Press platform.
Data correspond to usage on the plateform after 2015. The current usage metrics is available 48-96 hours after online publication and is updated daily on week days.
Initial download of the metrics may take a while.