Fig. 1.
Download original image
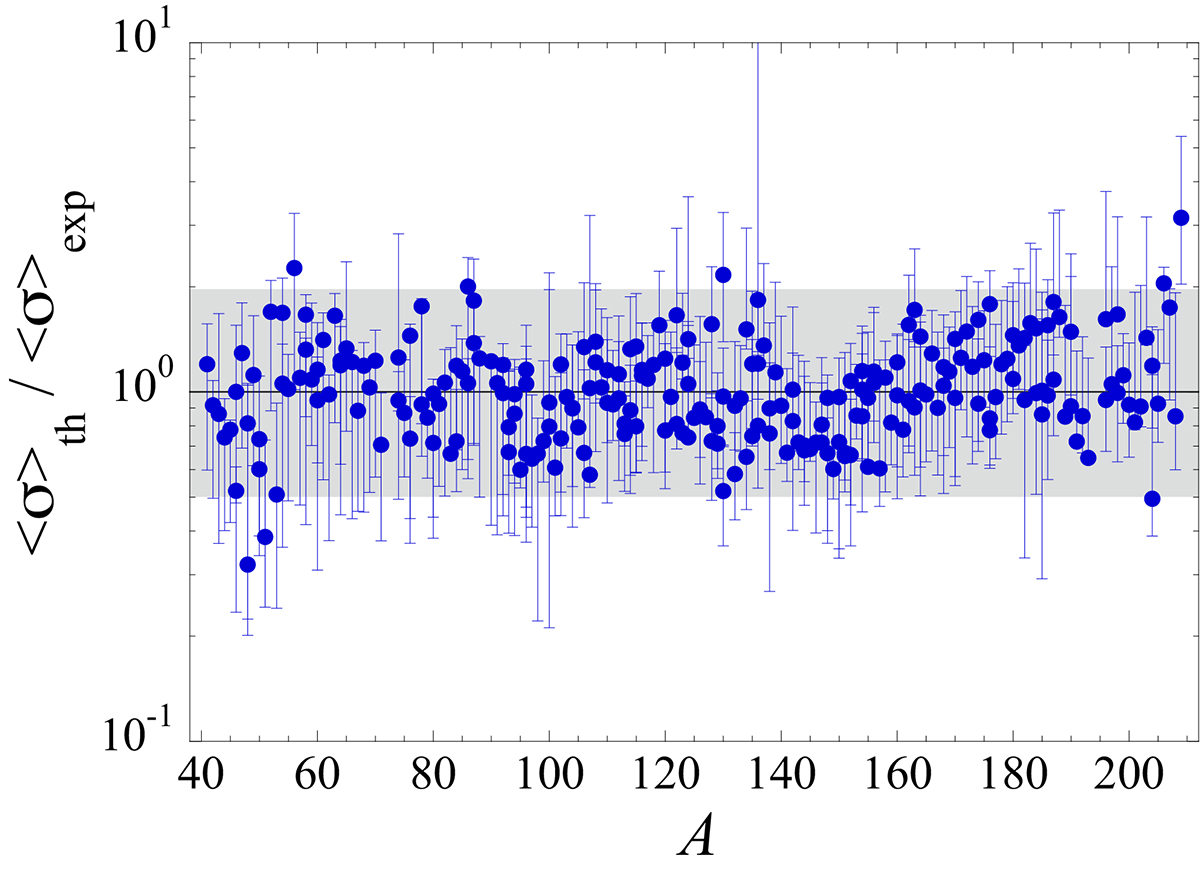
Theoretical over experimental (n, γ) MACS for the 239 experimentally known rates at 30 keV. The error bars display the maximum and minimum rates obtained by the nine different combinations of NLD and PSF models (including sets A and B; see text). The full circles correspond to set B and the gray shaded area shows variations within a factor of two.
Current usage metrics show cumulative count of Article Views (full-text article views including HTML views, PDF and ePub downloads, according to the available data) and Abstracts Views on Vision4Press platform.
Data correspond to usage on the plateform after 2015. The current usage metrics is available 48-96 hours after online publication and is updated daily on week days.
Initial download of the metrics may take a while.