Fig. 9.
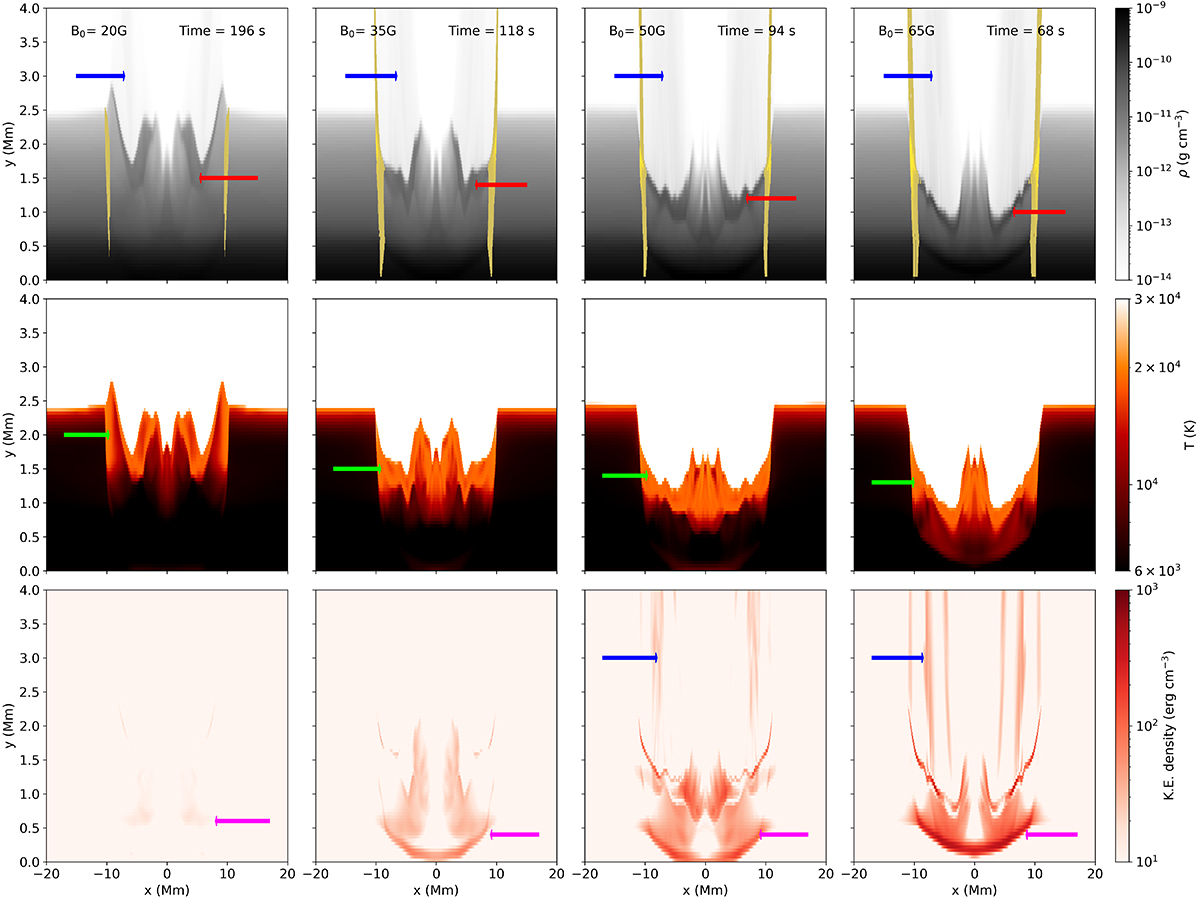
Download original image
Heating, downflows, and evaporation of chromospheric material in the models. The formatting is similar to that of Fig. 8, including those features that are highlighted by arrows. This figure shows the simulations with different background magnetic field strengths, each at similar stages in the evolution of the flare, after the impact and rebound of the reconnection outflow jet. A movie is available online.
Current usage metrics show cumulative count of Article Views (full-text article views including HTML views, PDF and ePub downloads, according to the available data) and Abstracts Views on Vision4Press platform.
Data correspond to usage on the plateform after 2015. The current usage metrics is available 48-96 hours after online publication and is updated daily on week days.
Initial download of the metrics may take a while.