Fig. 8.
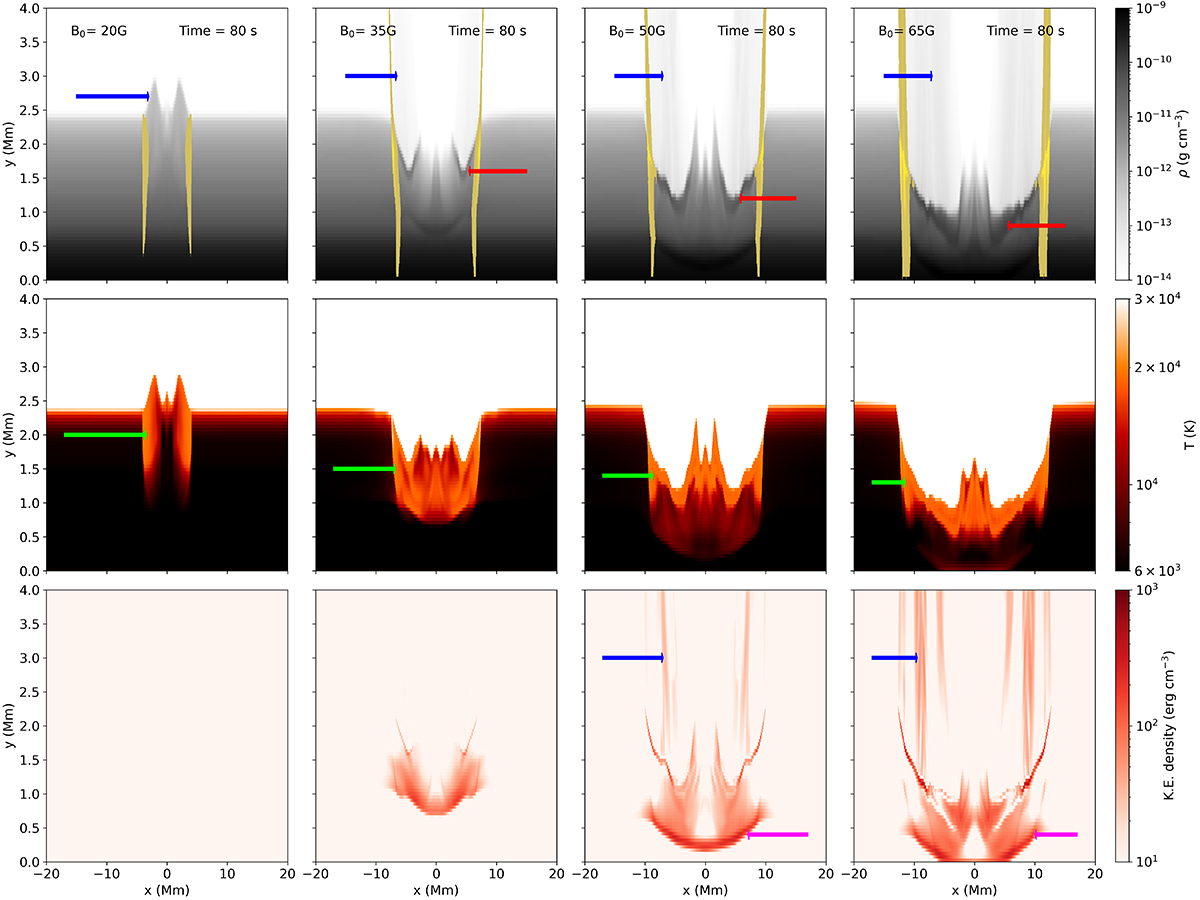
Download original image
Heating, downflows, and evaporation of chromospheric material. They are shown for simulations with increasing background magnetic field strengths in the columns from left to right, each at the same time during the simulation (t = 80 s). The top row shows the plasma density in grayscale, with electron energy deposition sites overlaid in yellow. Blue arrows indicate the locations of upflows from the chromosphere, evaporation in the case of all but the B0 = 20 G experiment. Red arrows indicate the high density impact fronts of downflowing material at the top of the chromosphere. The central panels show the temperature of the atmosphere, saturating to black at 6000 K and to white at 30 000 K. In this row green arrows indicate hot chromospheric material. The bottom rows show the kinetic energy densities with chromospheric evaporation signatures highlighted using blue arrows and significant energy transfer to photospheric levels indicated by magenta arrows.
Current usage metrics show cumulative count of Article Views (full-text article views including HTML views, PDF and ePub downloads, according to the available data) and Abstracts Views on Vision4Press platform.
Data correspond to usage on the plateform after 2015. The current usage metrics is available 48-96 hours after online publication and is updated daily on week days.
Initial download of the metrics may take a while.