Fig. 7.
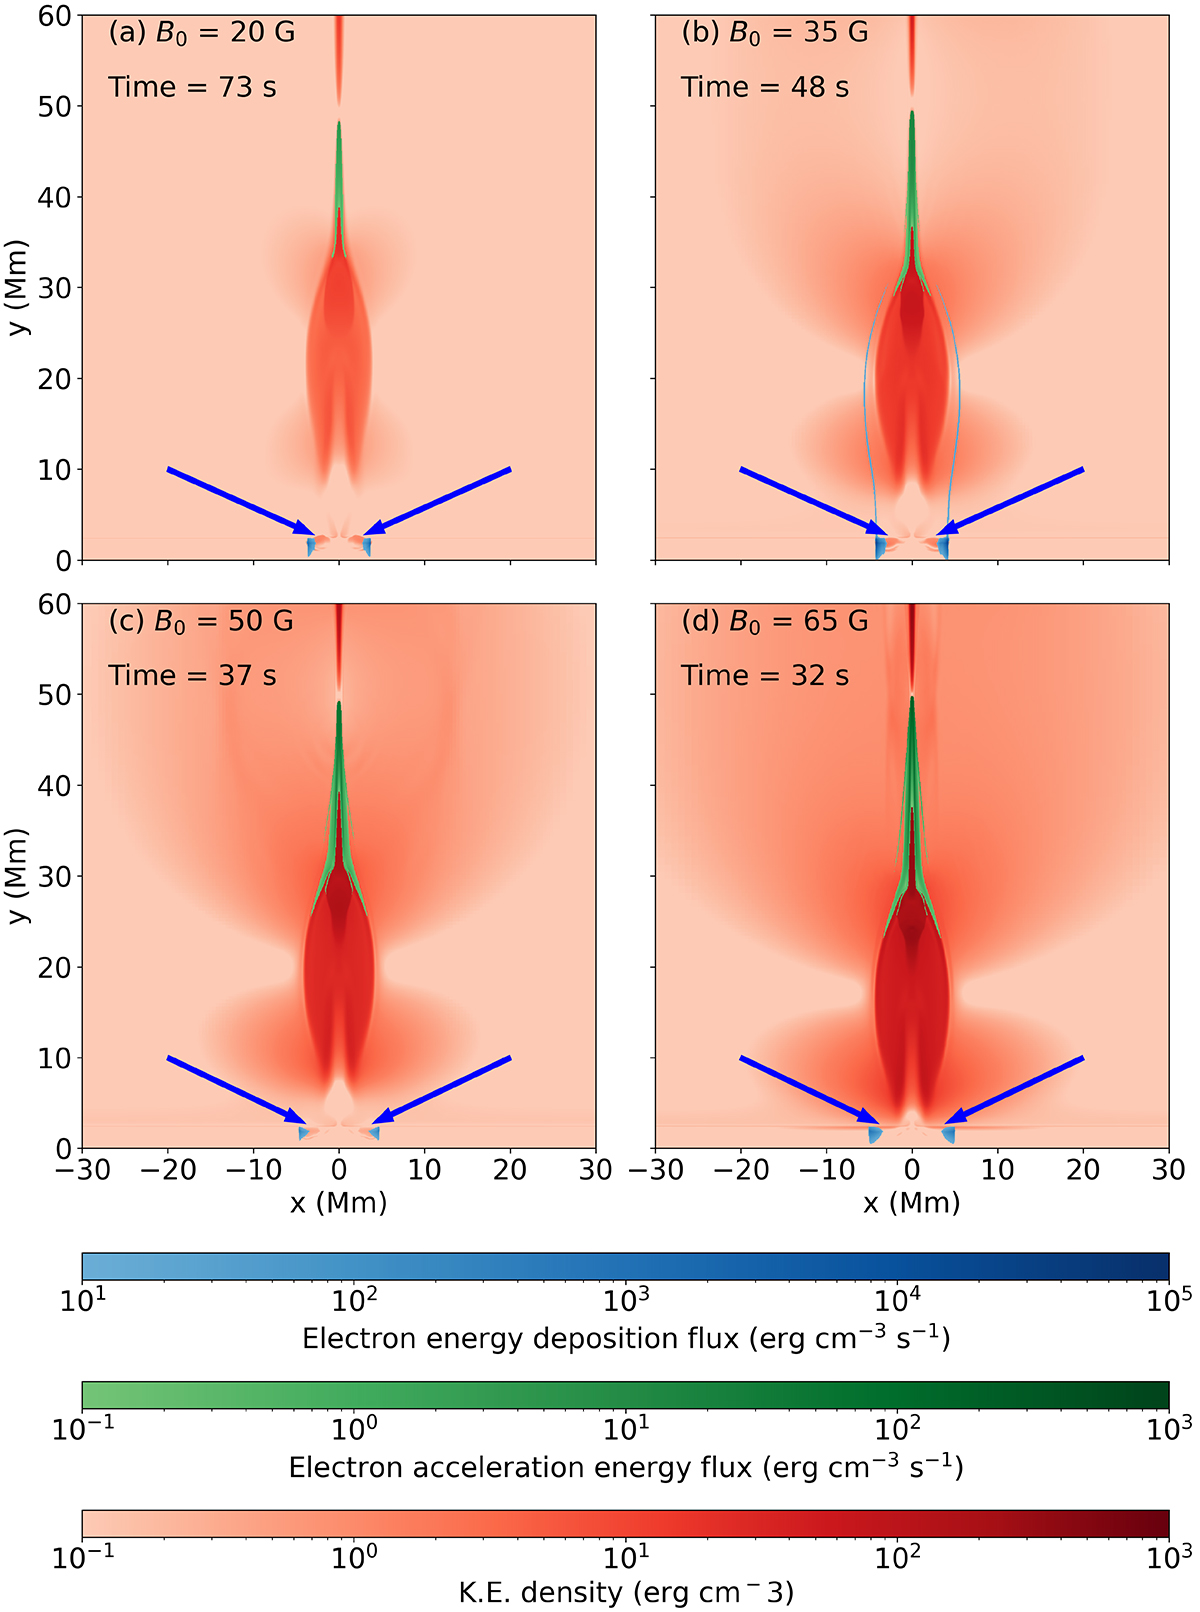
Download original image
Signatures of the electron beam effects on the lower atmosphere. Kinetic energy maps of the flares are shown in red, with the lobster claw reconnection outflows approaching the lower atmosphere for the experiments with B0 values of (a) 20 G at t = 73 s, (b) 35 G at t = 48 s, (c) 50 G at t = 50 s, and (d) 65 G at t = 32 s. Overlays show the electron acceleration densities in green and the energy deposition regions in blue. We note that the lower panels have energy deposition rates masked and scaled to values 100 times greater than the upper panels, in order not to completely cover the footpoint kinetic energy signatures, which are seen as small red blobs (Kinetic energy) next to the blue footpoints blobs (electron energy deposition) and highlighted with blue arrows.
Current usage metrics show cumulative count of Article Views (full-text article views including HTML views, PDF and ePub downloads, according to the available data) and Abstracts Views on Vision4Press platform.
Data correspond to usage on the plateform after 2015. The current usage metrics is available 48-96 hours after online publication and is updated daily on week days.
Initial download of the metrics may take a while.