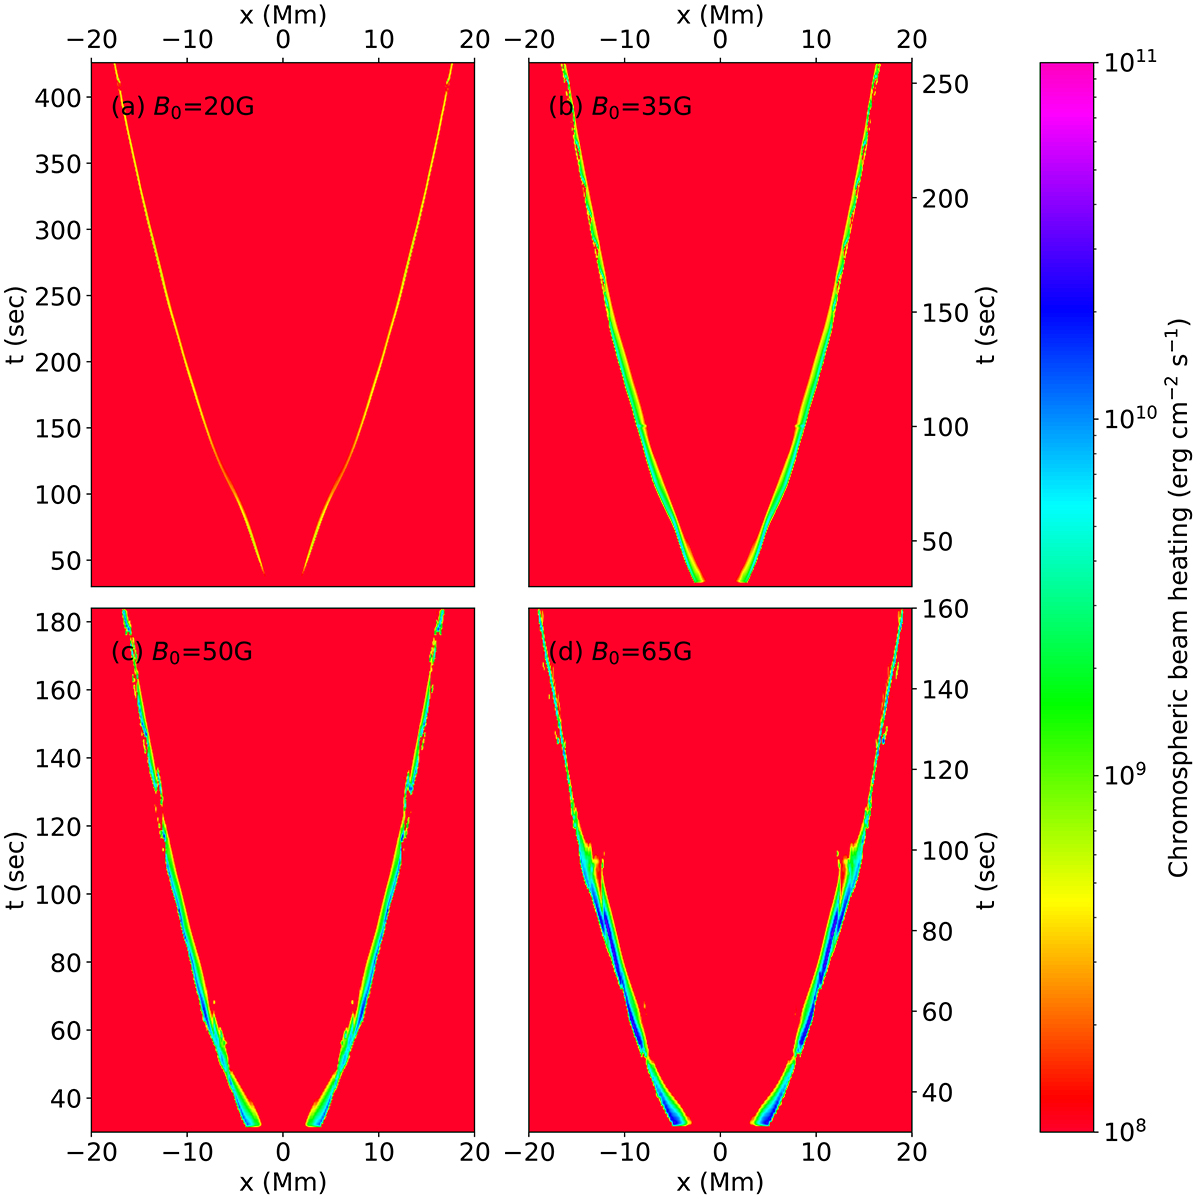
Fig. 6.
Download original image
Electron beam heating in the chromospheric footpoints. Each panel shows results for an experiment with a different background magnetic field strength. They are shown as functions of time (y-axis) and footpoint location (x-axis). The heating at each footpoint is computed by integrating the source term for the electron beam heating rate. We integrate this quantity over a vertical distance in the spatial domain that spans from the lower boundary of the experiment up to (but not including) the grid cell where the temperature first exceeds 50 000 K. The figure then shows the electron beam flux density that is applied down through the top of the “chromospheric” material and deposited at each footpoint. The color map saturates to red at the low end. This occurs at a beam strength of F8 (F0 = 10 × 108 erg cm−2 s−1), and thus the red color indicates negligible or zero beam heating.
Current usage metrics show cumulative count of Article Views (full-text article views including HTML views, PDF and ePub downloads, according to the available data) and Abstracts Views on Vision4Press platform.
Data correspond to usage on the plateform after 2015. The current usage metrics is available 48-96 hours after online publication and is updated daily on week days.
Initial download of the metrics may take a while.