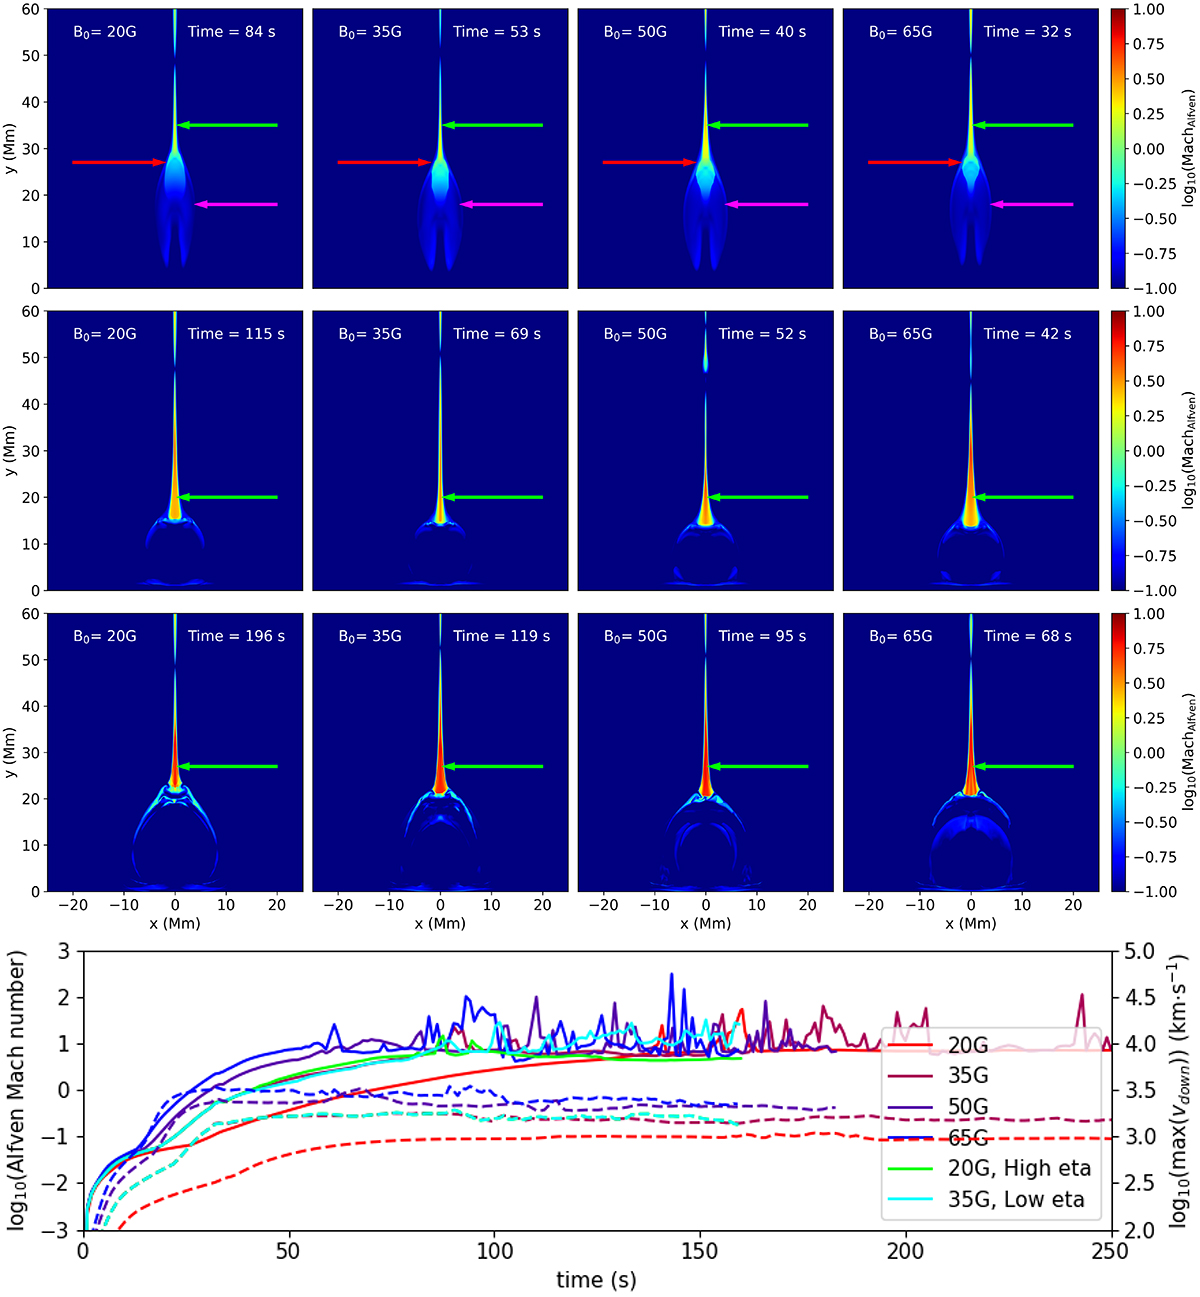
Fig. 4.
Download original image
Alfvén Mach numbers of the outflow reach similar ranges and values at similar evolution epochs, independent of field strength. They are shown just prior to the impact of the outflow on the chromosphere (top row), during the compression of the flare loops by the generation of the termination shock (second row), and after the rebound of the impact once the flare loops have settled (third row). In each row a green arrow highlights the fast mode shock in the reconnection outflow. In the top row a red arrow highlights the high-density core of the lobster claw outflow formation, and a magenta arrow points to the sub-Alfvénic “claws” of this structure. In the lower panel the logarithms of the maximum downward outflow speeds are shown with dashed lines (right axis), and the maximum of the Alfvén Mach numbers in these outflows is shown with solid lines.
Current usage metrics show cumulative count of Article Views (full-text article views including HTML views, PDF and ePub downloads, according to the available data) and Abstracts Views on Vision4Press platform.
Data correspond to usage on the plateform after 2015. The current usage metrics is available 48-96 hours after online publication and is updated daily on week days.
Initial download of the metrics may take a while.