Fig. 3.
Download original image
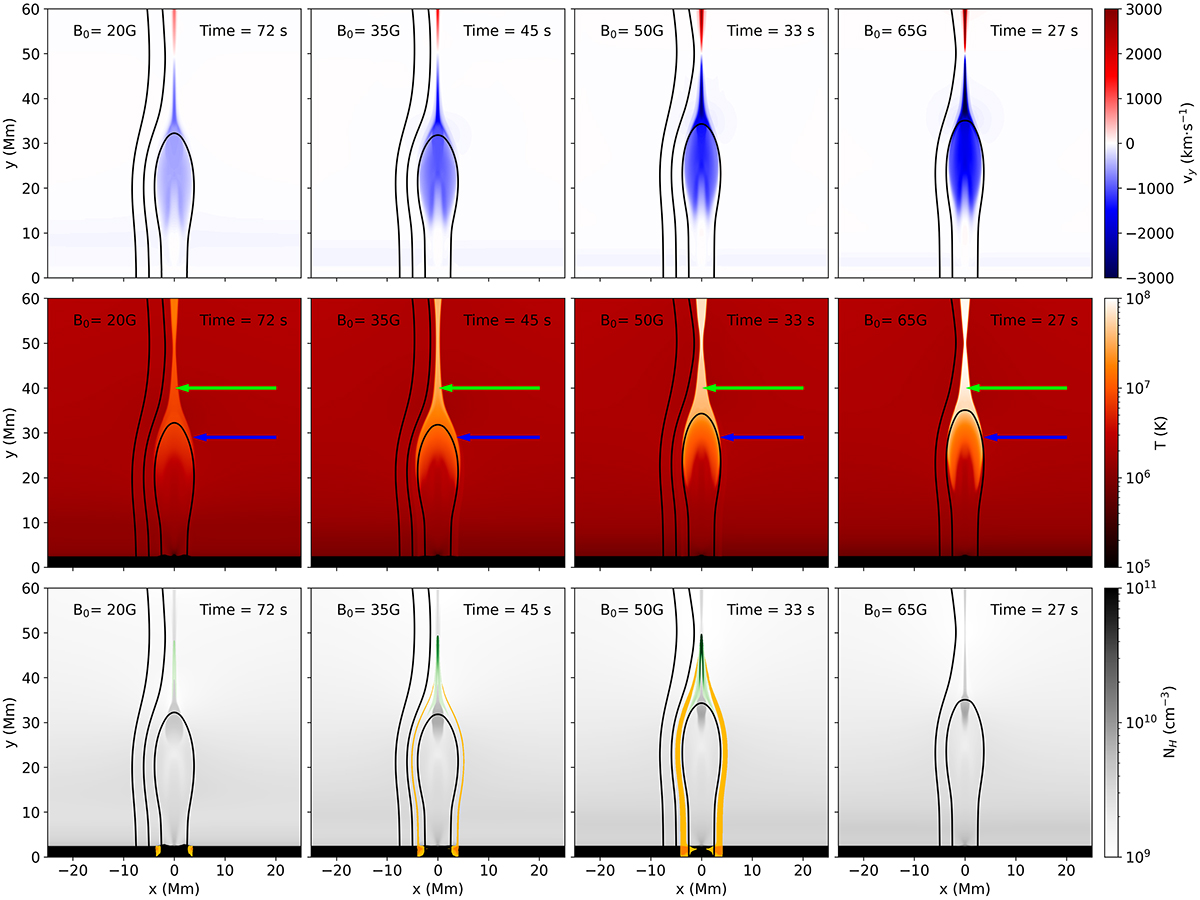
Reconnection outflow jets of the experiments with different background magnetic field strengths. They are shown at similar morphological stages of the experiment evolution. The columns show results for different background magnetic field strengths, from B0 = 20 G on the left to B0 = 65 G on the right. The top panels show the vertical velocities of the models, and the central row shows temperatures. In the temperature panels, green arrows indicate the concentration of high temperature in the tails of the reconnection outflows, the blue arrows indicate the hotter areas at the rear of the lobster claw forms that lead the reconnection outflows. The bottom row shows plasma number density. Each panel also shows magnetic field lines in black. These are traced from footpoints at x = −2.5, −5.0, and −7.5 Mm in instances where these lines are being processed by the 1D field-line routines. In the number density panels (bottom row), beam electron acceleration sites are shown in green, and the locations where energetic electrons deposit their energy are shown in yellow.
Current usage metrics show cumulative count of Article Views (full-text article views including HTML views, PDF and ePub downloads, according to the available data) and Abstracts Views on Vision4Press platform.
Data correspond to usage on the plateform after 2015. The current usage metrics is available 48-96 hours after online publication and is updated daily on week days.
Initial download of the metrics may take a while.