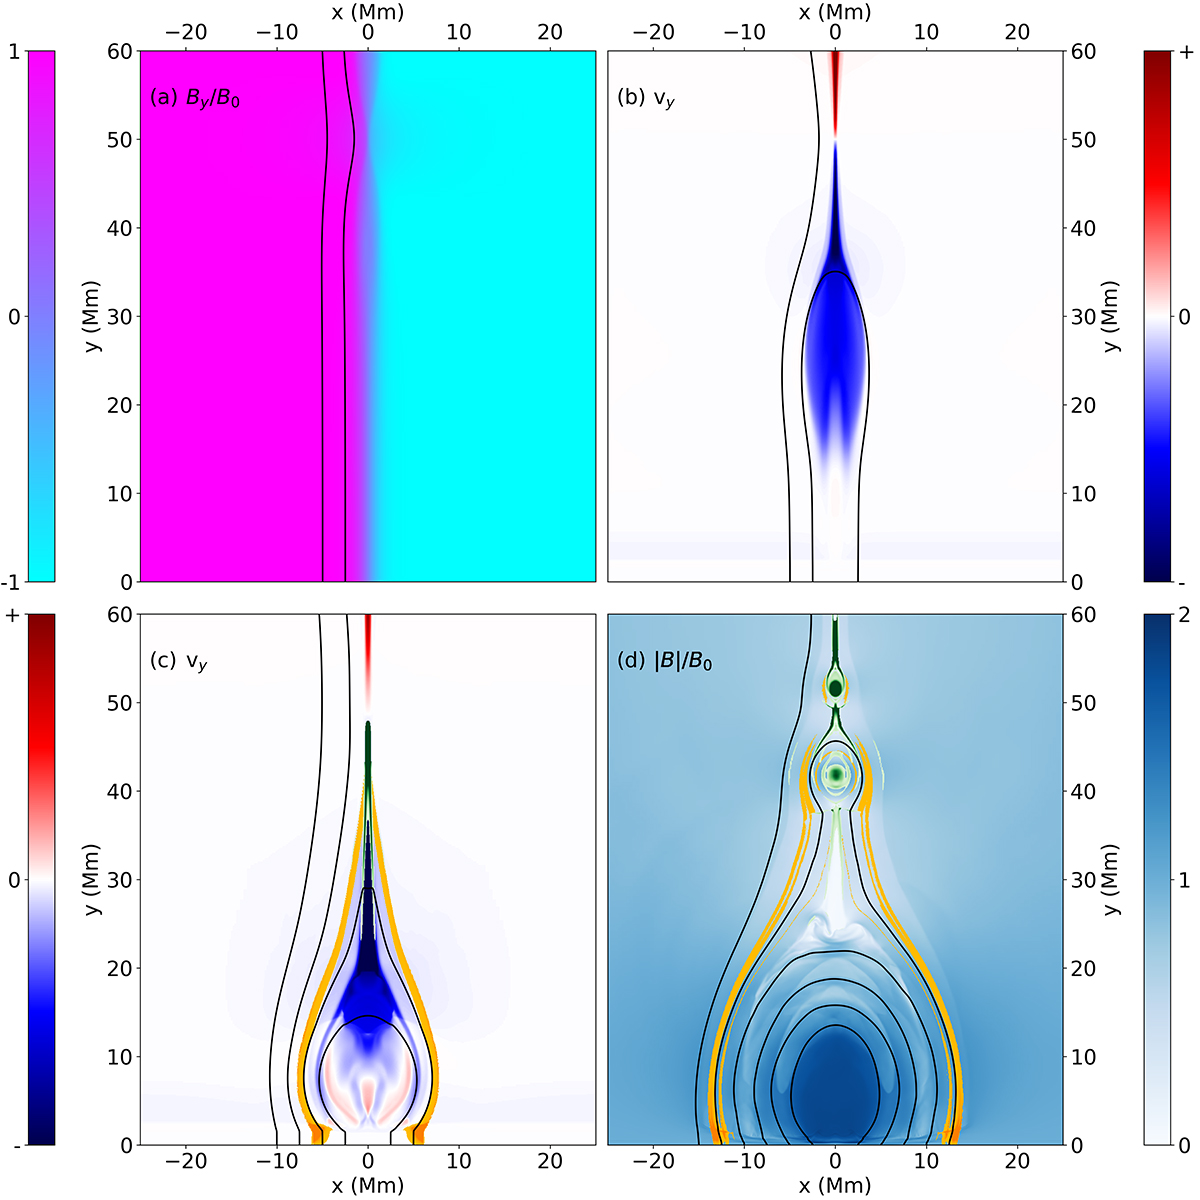
Fig. 2.
Download original image
Simulated analog of the standard solar flare model. Panel a shows By/B0. All the simulations presented here start from a bipolar field region with an anomalous resistivity patch at a height of y = 50 Mm over the polarity inversion line, which causes the field to reconnect and release stored magnetic energy. Panel b shows the typical vertical velocity (vy) structure at a time before the impact of the reconnection outflow on the lower atmosphere. Positive velocity (red) represents upward motion, and negative represents downward motions (blue). The reconnection outflow jets form at the X point, where reconnection occurs; one jet flows downward, and the other, upward jet leaves the domain via the top boundary. Panel c shows the vertical velocity at the time when the reconnection jet impacts the lower atmosphere. Panel d shows the typical flare loop system that is formed via this process, through a plot of absolute magnetic field strengths. Energetic electron transport is switched on after 31.2 s of the simulation. Thus, in all cases presented in this manuscript, the electrons are switched on before the impact of the reconnection jet on the lower atmosphere. In the lower panels, electron acceleration sites are shown in green and energy deposition locations in yellow. The energy deposition locations are saturated at very low values to help indicate their paths through the experiment. In fact, these beams deposit the majority of their energy in the lower atmosphere at the footpoints of the flare loops.
Current usage metrics show cumulative count of Article Views (full-text article views including HTML views, PDF and ePub downloads, according to the available data) and Abstracts Views on Vision4Press platform.
Data correspond to usage on the plateform after 2015. The current usage metrics is available 48-96 hours after online publication and is updated daily on week days.
Initial download of the metrics may take a while.