Fig. 12.
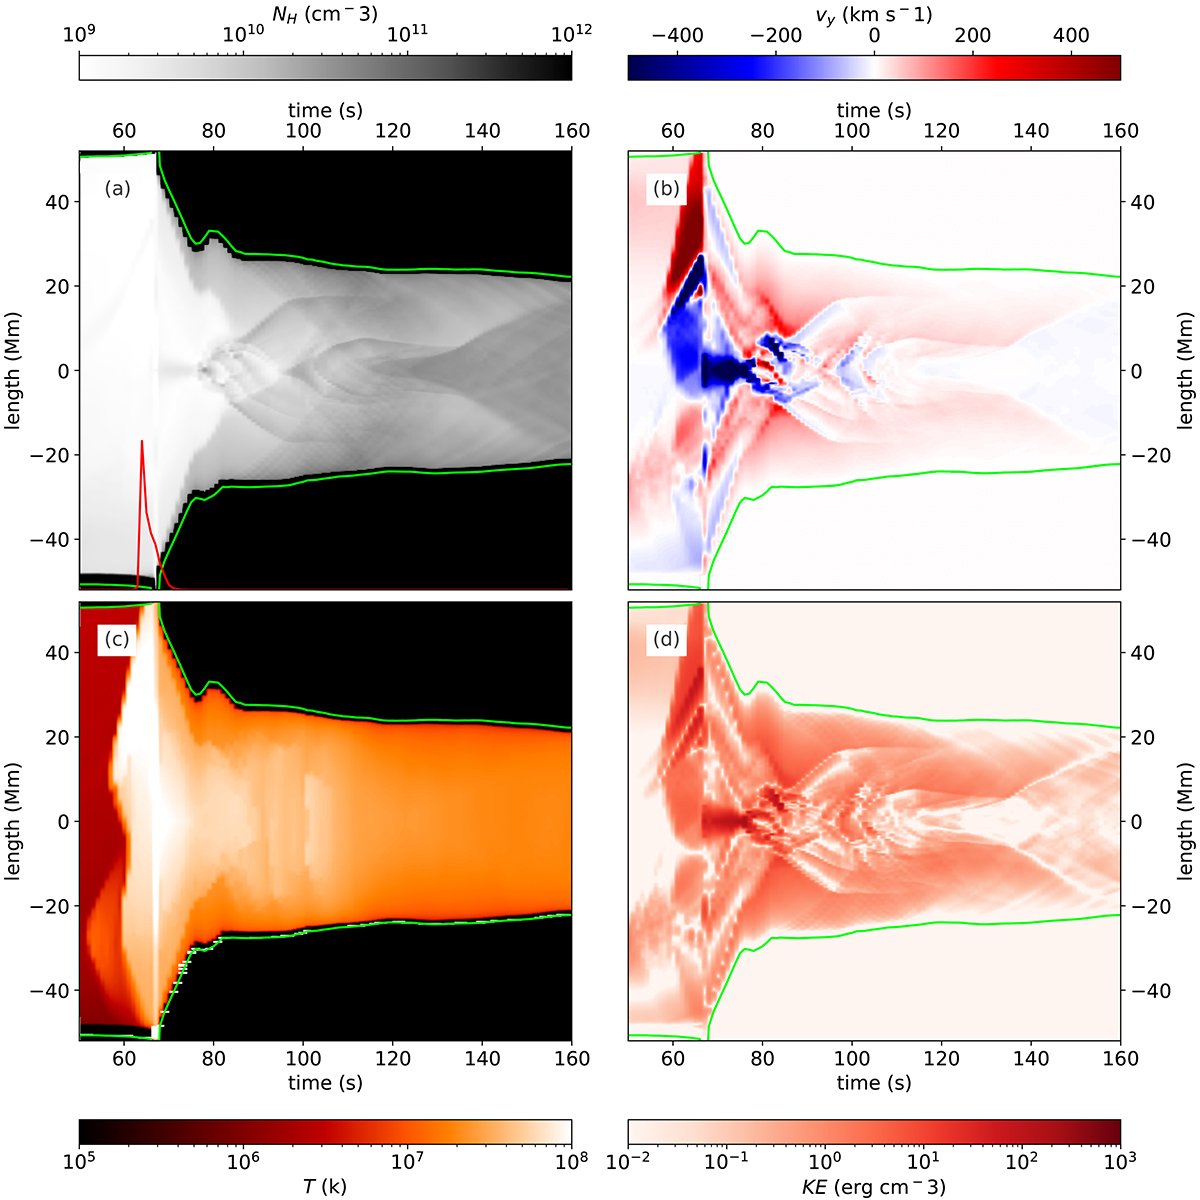
Download original image
Evolution of the atmosphere along a single field line with one footpoint at x = −10 Mm, discussed in Sect. 3.4.1 (B0 = 65 G, x = −10 Mm, F0 = 1.0F10). They are shown in plots of time on the horizontal axis and length, s, along the field line vertically, with s = 0 at x = −10 Mm, y = 0 Mm. The parameters shown are (a) plasma number density, (b) the vertical velocity, (c) the plasma temperature, (d) the kinetic energy density. The plasma number density panel show the beam electron energy flux deposited in the chromosphere above the left footpoint, over-plotted in red. This over-plot is scaled such that the maximum electron energy flux deposited throughout the entire simulation (4.7 × 10¹⁰ erg cm−2 s−1) corresponds to the peak reaching top of the panel, with zero at the bottom. The beam in this field line reaches a peak flux of 1.0 × 10¹⁰ erg cm−2 s−1. We note that the field line changes in overall length as a function of time. The extent of the experimental domain is highlighted with green lines in each panel. Before reconnection this highlights the bottom and top of the experiment, after reconnection these highlight the locations of the photospheric footpoints in each time step. Values outside of this are saturated to their photospheric values for continuity, but do not represent simulated values.
Current usage metrics show cumulative count of Article Views (full-text article views including HTML views, PDF and ePub downloads, according to the available data) and Abstracts Views on Vision4Press platform.
Data correspond to usage on the plateform after 2015. The current usage metrics is available 48-96 hours after online publication and is updated daily on week days.
Initial download of the metrics may take a while.