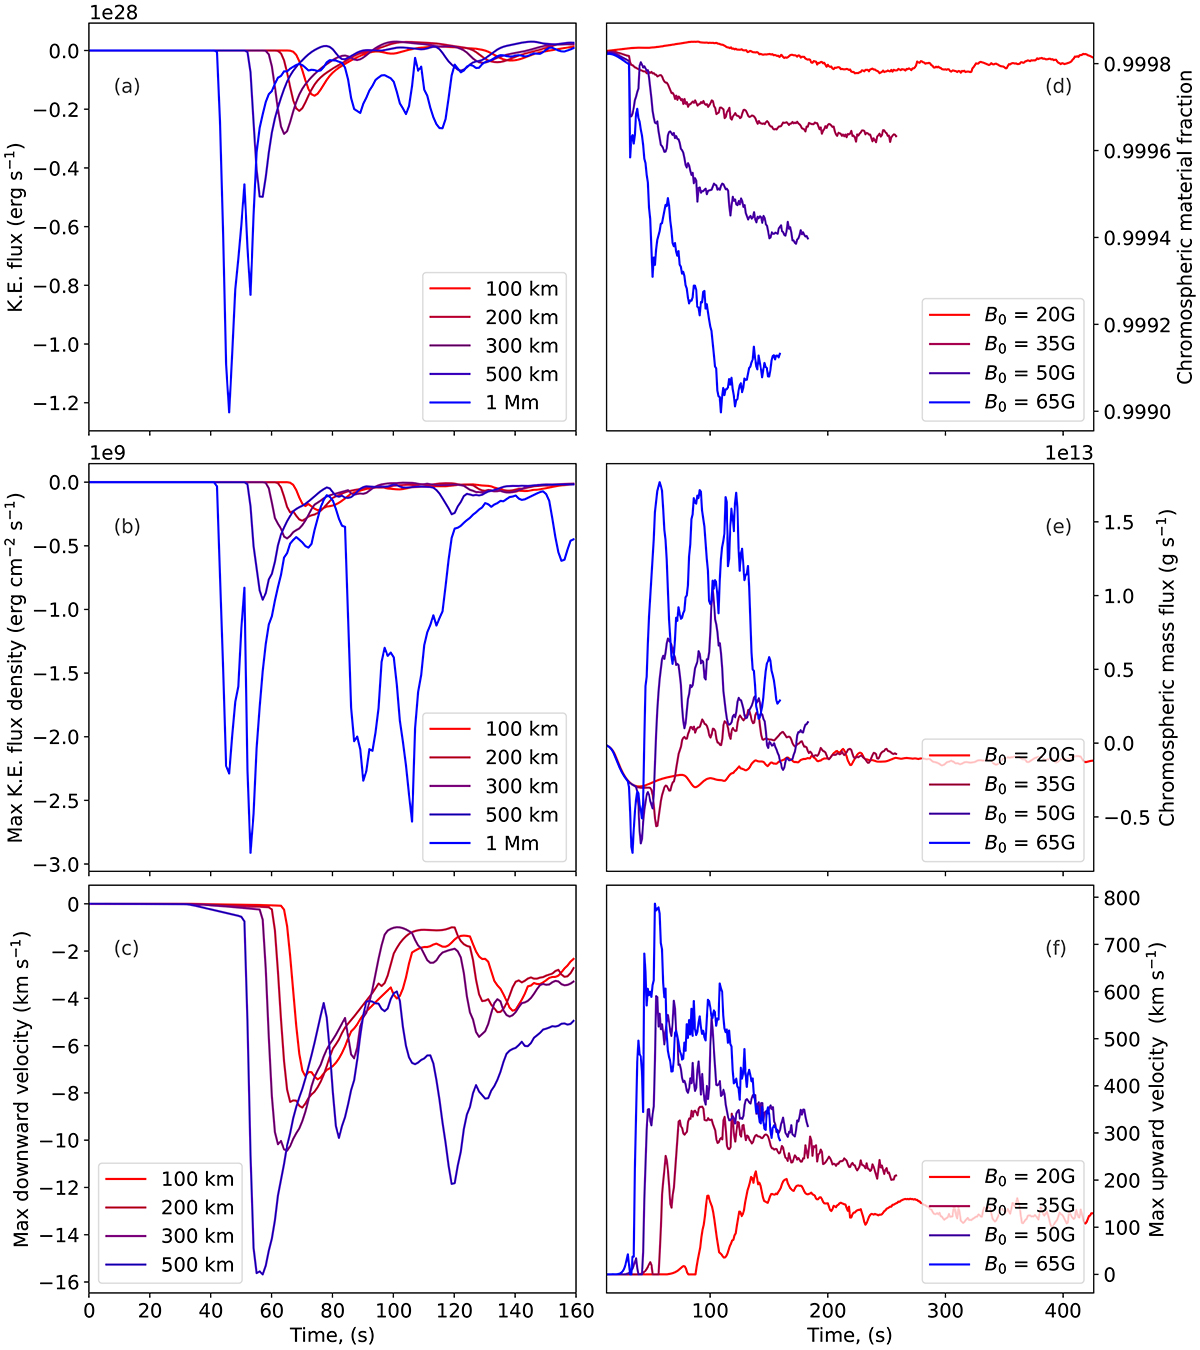
Fig. 10.
Download original image
Impact of the flare on the dynamics of the lower atmosphere. The left column shows results for the B0 = 65 G simulation, while the right panels compare all four experiments. Shown are: (a) the total kinetic energy flux (assuming a the third-dimension depth of 100 Mm), (b) the maximum kinetic energy density directed downward, and (c) the maximum downward velocity, all shown at various heights near the photosphere. In the right column of panels we show: (d) the fraction of the lower atmospheric material that is chromospheric as functions of time for the different experiments, (e) the mass fluxes (assuming a third-dimension depth of 100 Mm), and (f) the maximum upward velocities of material, each taken at 5 Mm height.
Current usage metrics show cumulative count of Article Views (full-text article views including HTML views, PDF and ePub downloads, according to the available data) and Abstracts Views on Vision4Press platform.
Data correspond to usage on the plateform after 2015. The current usage metrics is available 48-96 hours after online publication and is updated daily on week days.
Initial download of the metrics may take a while.