Fig. 1.
Download original image
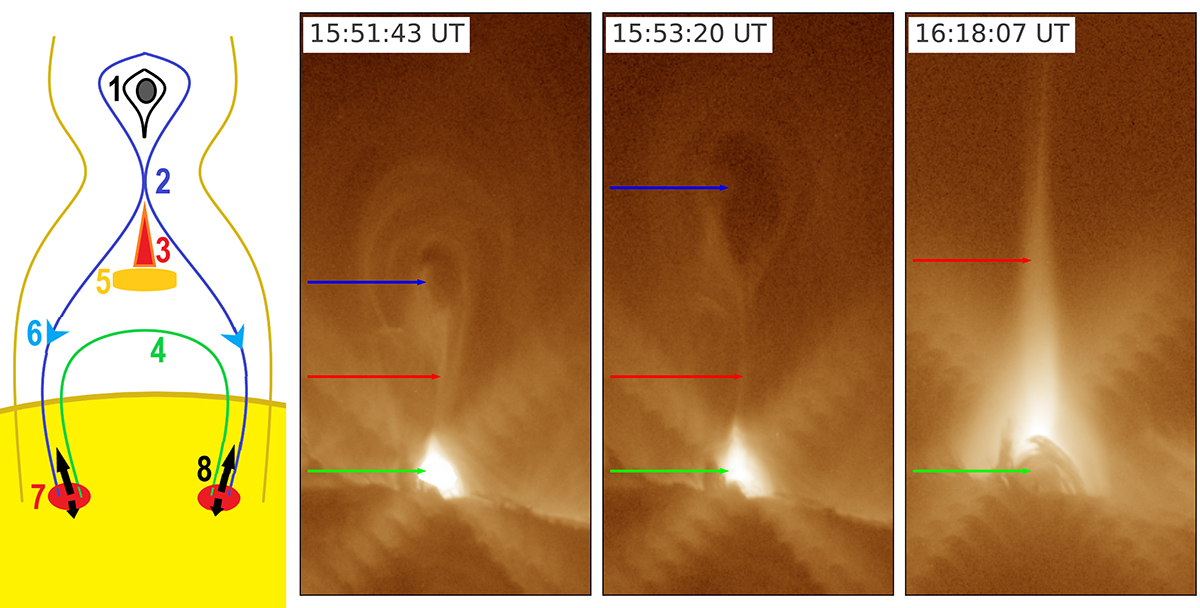
Standard solar flare model. Left: Standard solar flare model in 2D, with features labeled as per the numbered points in Sect. 1, namely (1) a flux rope running normal to the plane of the cross section, (2) reconnecting field lines at an X point, (3) reconnection outflow jets, (4) reconnected hot loops that gather below the X point, (5) a termination shock, (6) field-aligned transport of energy down to the lower atmosphere (7) flare ribbons, and (8) chromospheric evaporation and downflowing chromospheric compressions. Right: Images of a solar flare over the solar limb taken with the Atmospheric Imaging Assembly (AIA) aboard the Solar Dynamics Observatory (SDO, Lemen et al. 2012) on September 10, 2017, showing the form of the standard solar flare model early in the flare (at 15:51:43 UT) in the 193 Å channel, with the loop arches at the base (green arrows) and a flux rope above it (blue arrows). Slightly later (at 15:53:20 UT) we see the flux rope erupting (moving upward). Later (at 16:18:07 UT) the flux rope has left the field of view and we see emission that is interpreted as originating from the long bright current sheet (red arrows) and dense coronal flare loops below (green arrows). These images use the short exposure AIA filters but still display significant fringe artifacts emanating outward from the bright loop arches.
Current usage metrics show cumulative count of Article Views (full-text article views including HTML views, PDF and ePub downloads, according to the available data) and Abstracts Views on Vision4Press platform.
Data correspond to usage on the plateform after 2015. The current usage metrics is available 48-96 hours after online publication and is updated daily on week days.
Initial download of the metrics may take a while.