Fig. 13
Download original image
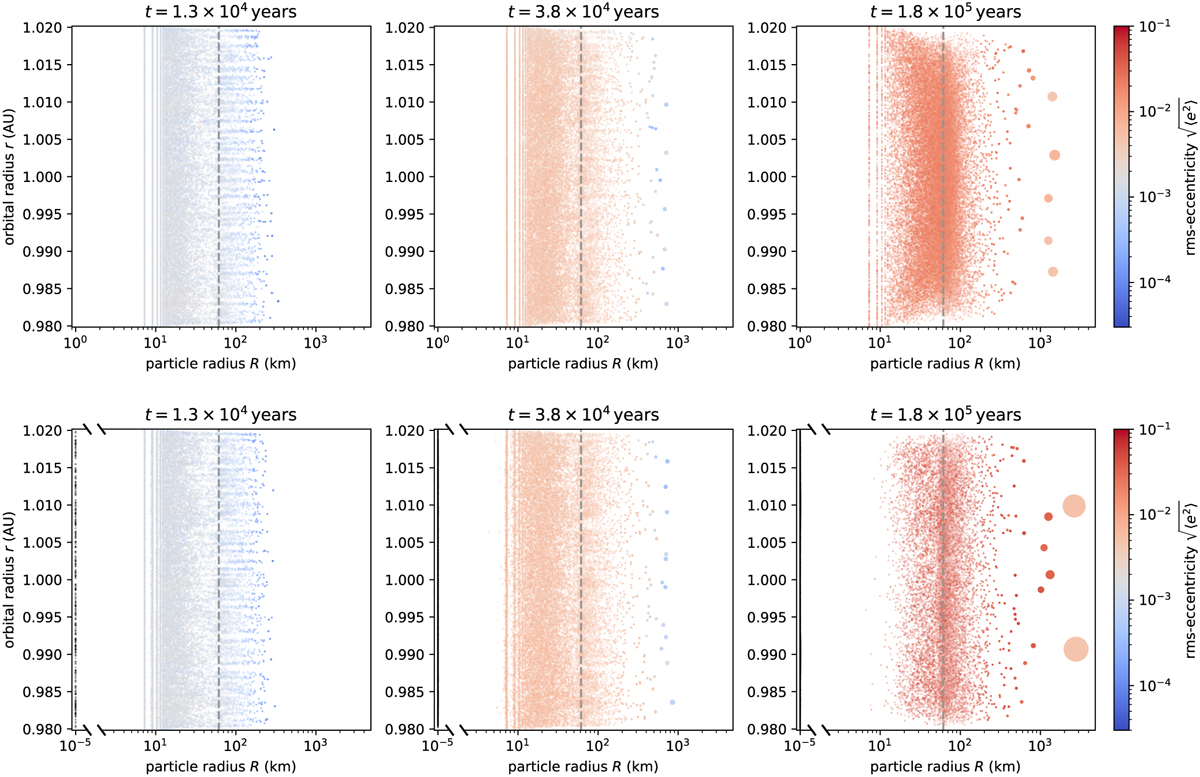
Results for the simplified Ormel’s model starting with n0 = 32 768 representative particles. Top row: ϵ = 0 (no fragmentation); bottom row: ϵ = 0.01 (rubble pile model). Every swarm is represented by a spherical shape with a colour indicating its planar rms eccentricity. The area covered by the shape represents the mass in the swarm. All swarms initially have the same mass, but individual particles can accrete mass held by other swarms and thereby grow beyond their initial swarm size. The vertical lines indicate the critical radius Rcrit (Eq. (127)) which marks the approximate boundary between many-particles and few-particles swarms.
Current usage metrics show cumulative count of Article Views (full-text article views including HTML views, PDF and ePub downloads, according to the available data) and Abstracts Views on Vision4Press platform.
Data correspond to usage on the plateform after 2015. The current usage metrics is available 48-96 hours after online publication and is updated daily on week days.
Initial download of the metrics may take a while.