Fig. 10
Download original image
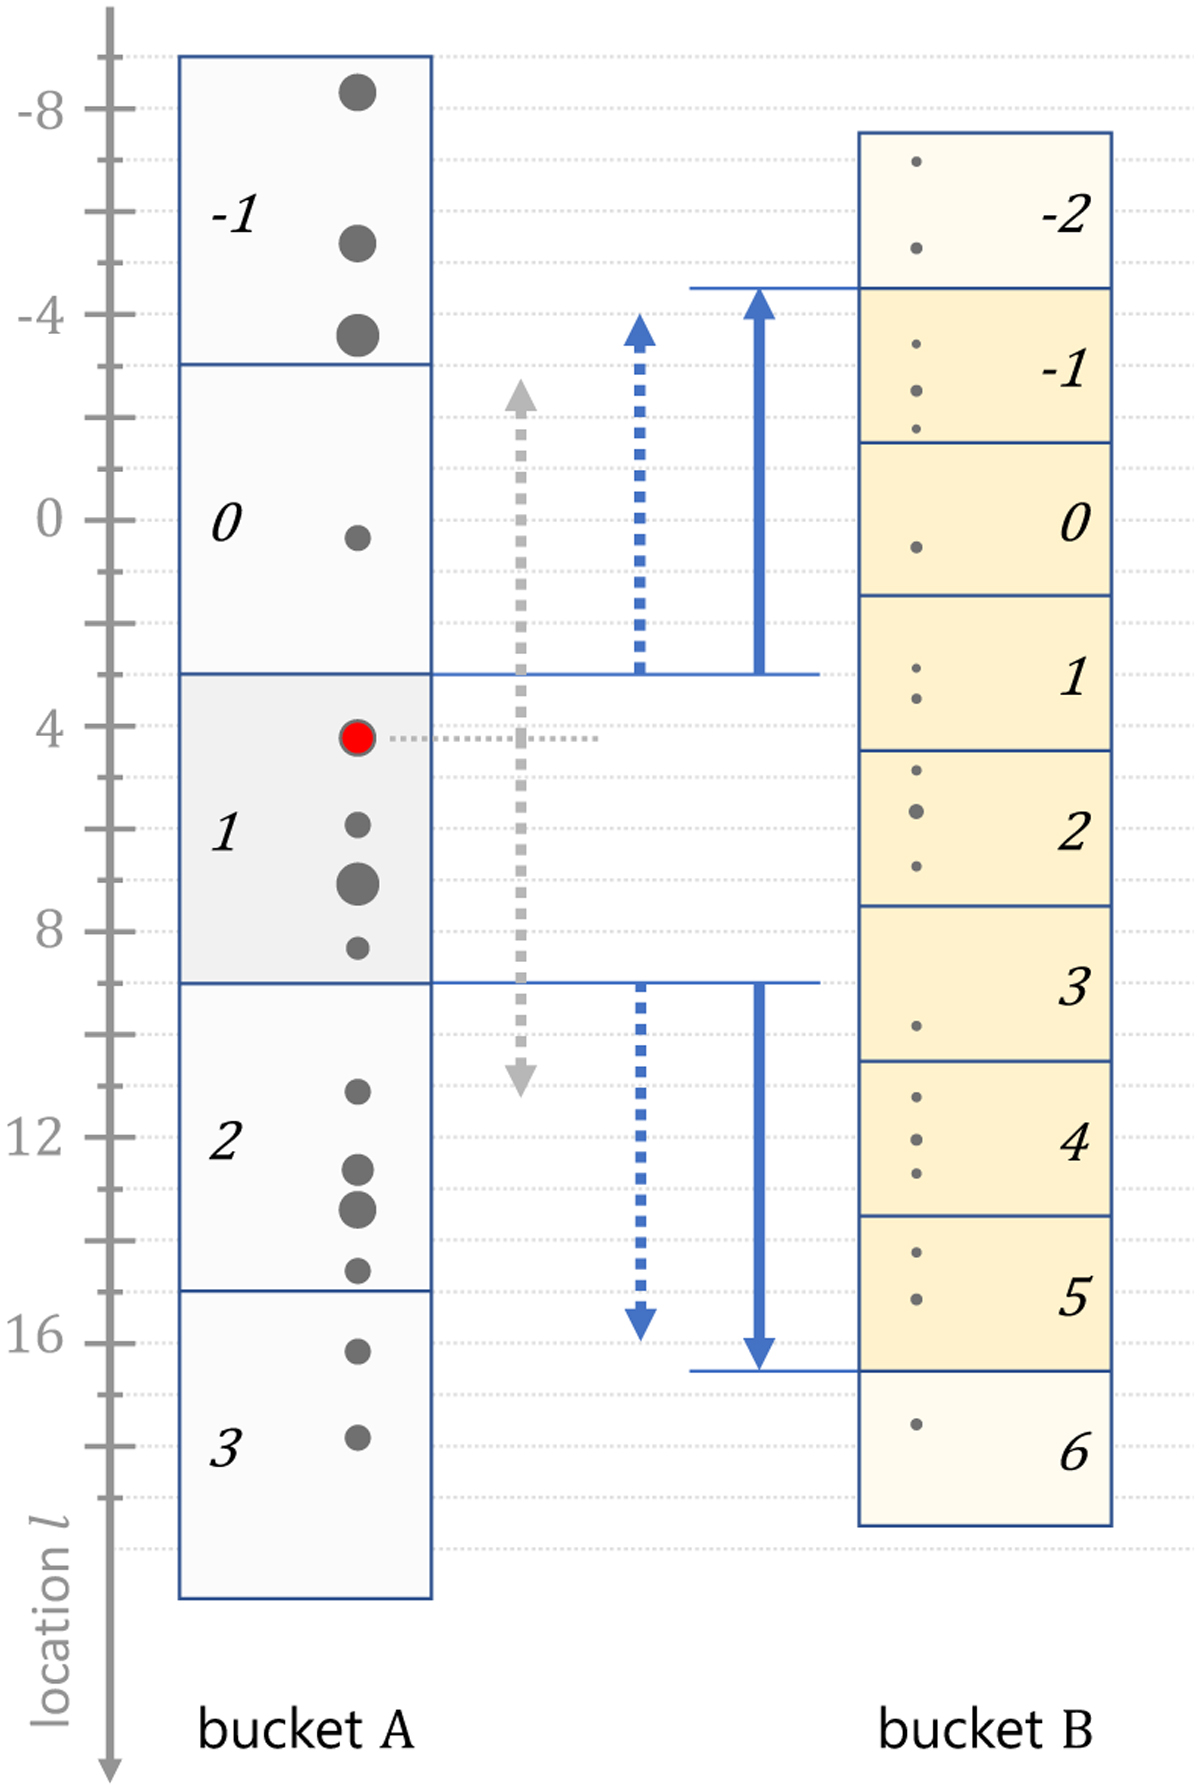
Sub-bucket grouping with interaction distance bounds. The sub-buckets of two buckets A and B and the entities populating them are shown. Sub-bucket indices as per Eq. (110) are indicated in italic type. The arrows indicate: the range of possible A–B interactions, as per the bucket interaction distance bound ![]() , for the entity highlighted in red (grey, dotted); the range and the rounded range of possible interactions for sub-bucket 1 from bucket A (blue, dotted, and solid). In bucket B, the range of sub-buckets UB,A(1) in reach of sub-bucket 1 from bucket A (Eq. (112)) are highlighted.
, for the entity highlighted in red (grey, dotted); the range and the rounded range of possible interactions for sub-bucket 1 from bucket A (blue, dotted, and solid). In bucket B, the range of sub-buckets UB,A(1) in reach of sub-bucket 1 from bucket A (Eq. (112)) are highlighted.
Current usage metrics show cumulative count of Article Views (full-text article views including HTML views, PDF and ePub downloads, according to the available data) and Abstracts Views on Vision4Press platform.
Data correspond to usage on the plateform after 2015. The current usage metrics is available 48-96 hours after online publication and is updated daily on week days.
Initial download of the metrics may take a while.