Fig. 7
Download original image
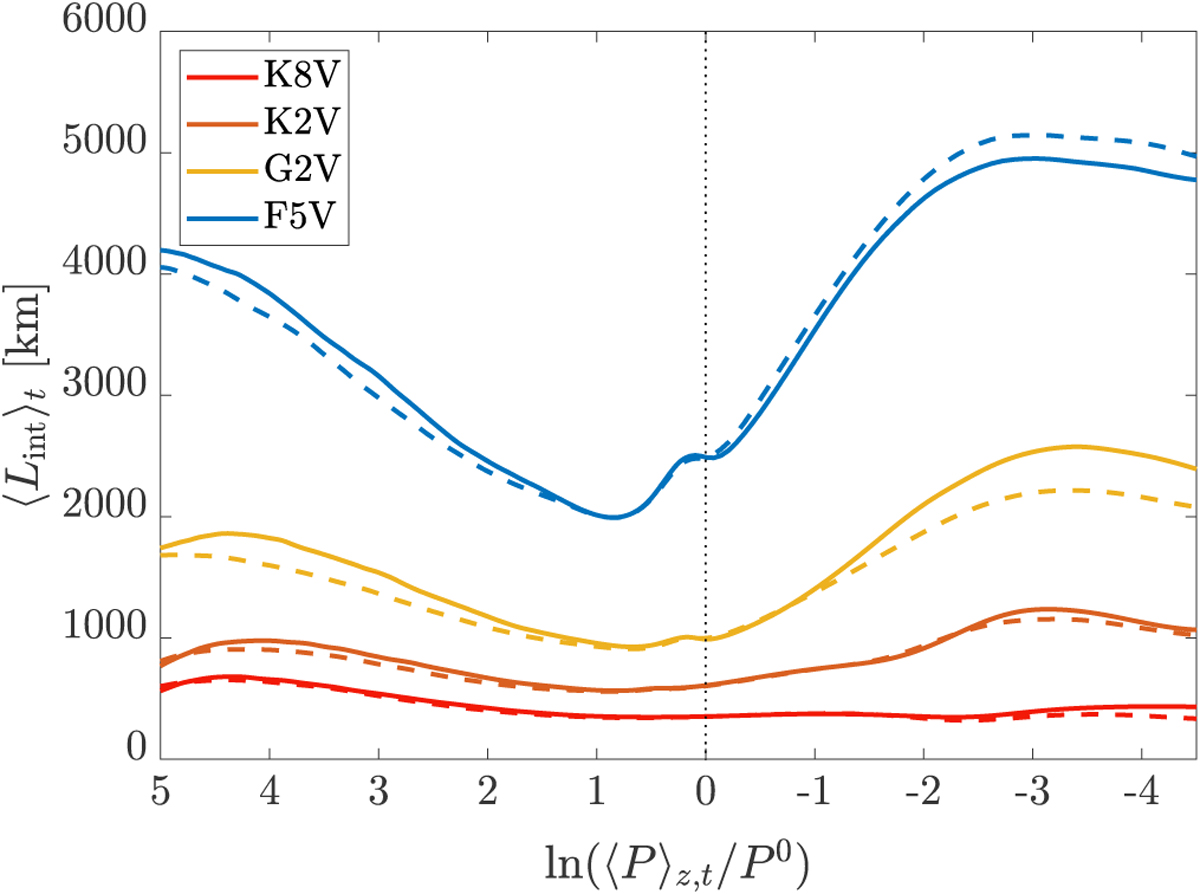
Integral length scale of vertical velocity fluctuations for the four models. The solid and dashed coloured lines denote phases 1 and 3, respectively. The black dotted line denotes the geometrical height z = 0; to the left of the line is the convection zone, and to the right the photosphere.
Current usage metrics show cumulative count of Article Views (full-text article views including HTML views, PDF and ePub downloads, according to the available data) and Abstracts Views on Vision4Press platform.
Data correspond to usage on the plateform after 2015. The current usage metrics is available 48-96 hours after online publication and is updated daily on week days.
Initial download of the metrics may take a while.