Fig. 5
Download original image
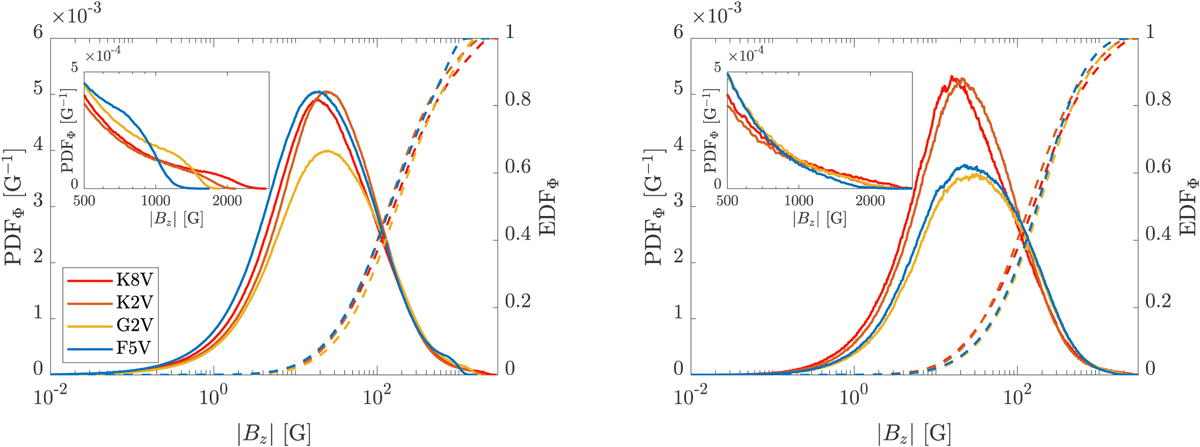
Magnetic flux distributions. Flux-based probability density functions (solid lines, left axis) and corresponding empirical distribution functions (dashed lines, right axis) as a function of |Bz| at z = 0 (left panel) and τR = 1 (right panel) for the four models during phase 3. The insets in the top left corners of the larger panels display zoomed-in images of PDFΦ at high magnetic field strengths.
Current usage metrics show cumulative count of Article Views (full-text article views including HTML views, PDF and ePub downloads, according to the available data) and Abstracts Views on Vision4Press platform.
Data correspond to usage on the plateform after 2015. The current usage metrics is available 48-96 hours after online publication and is updated daily on week days.
Initial download of the metrics may take a while.