Fig. 3
Download original image
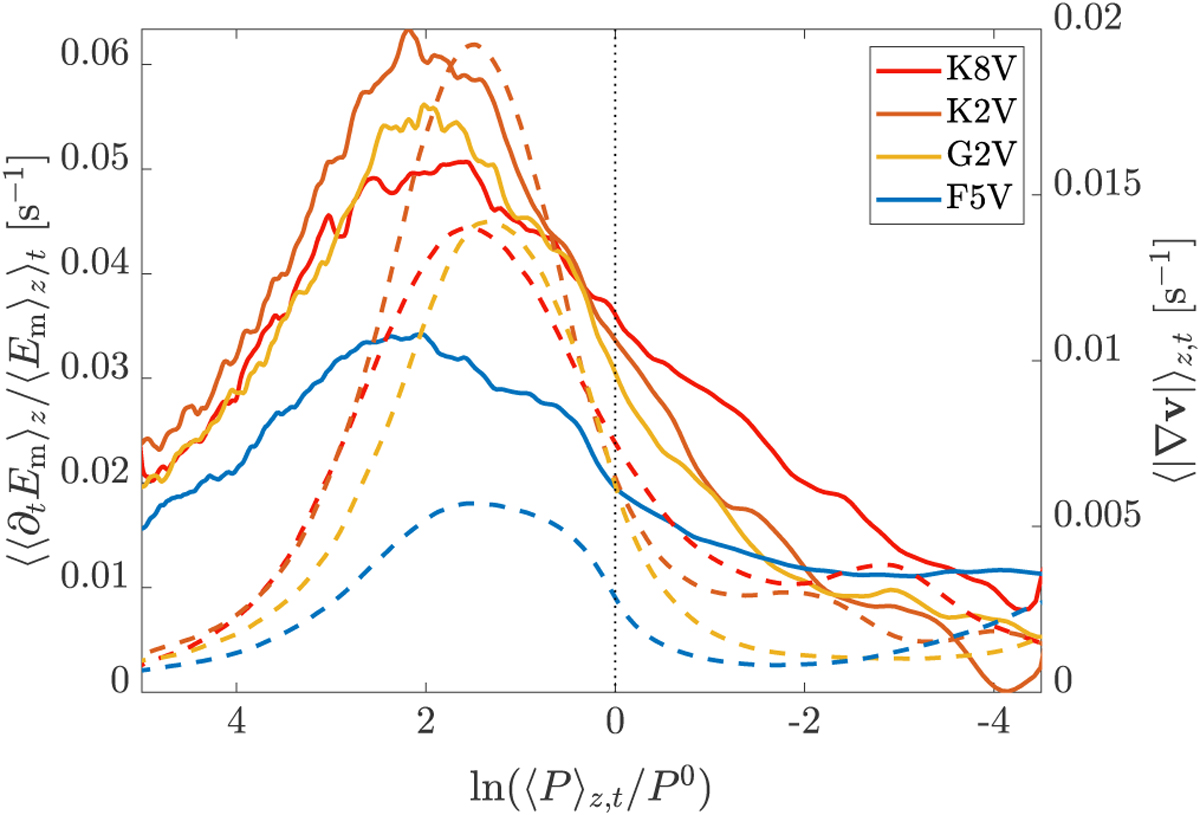
Time-averaged profiles of 〈∂tEm〉z/〈Em〉z (solid lines, left axis, smoothed for clarity with a moving average of width 10∆z) and computed during the kinematic phase, and of 〈|∇v|〉z,t (dashed lines, right axis) for the four models K8V, K2V, G2V, and F5V. The black dotted line denotes the geometrical height z = 0. To the left of this line is the convection zone; the photosphere is to the right.
Current usage metrics show cumulative count of Article Views (full-text article views including HTML views, PDF and ePub downloads, according to the available data) and Abstracts Views on Vision4Press platform.
Data correspond to usage on the plateform after 2015. The current usage metrics is available 48-96 hours after online publication and is updated daily on week days.
Initial download of the metrics may take a while.