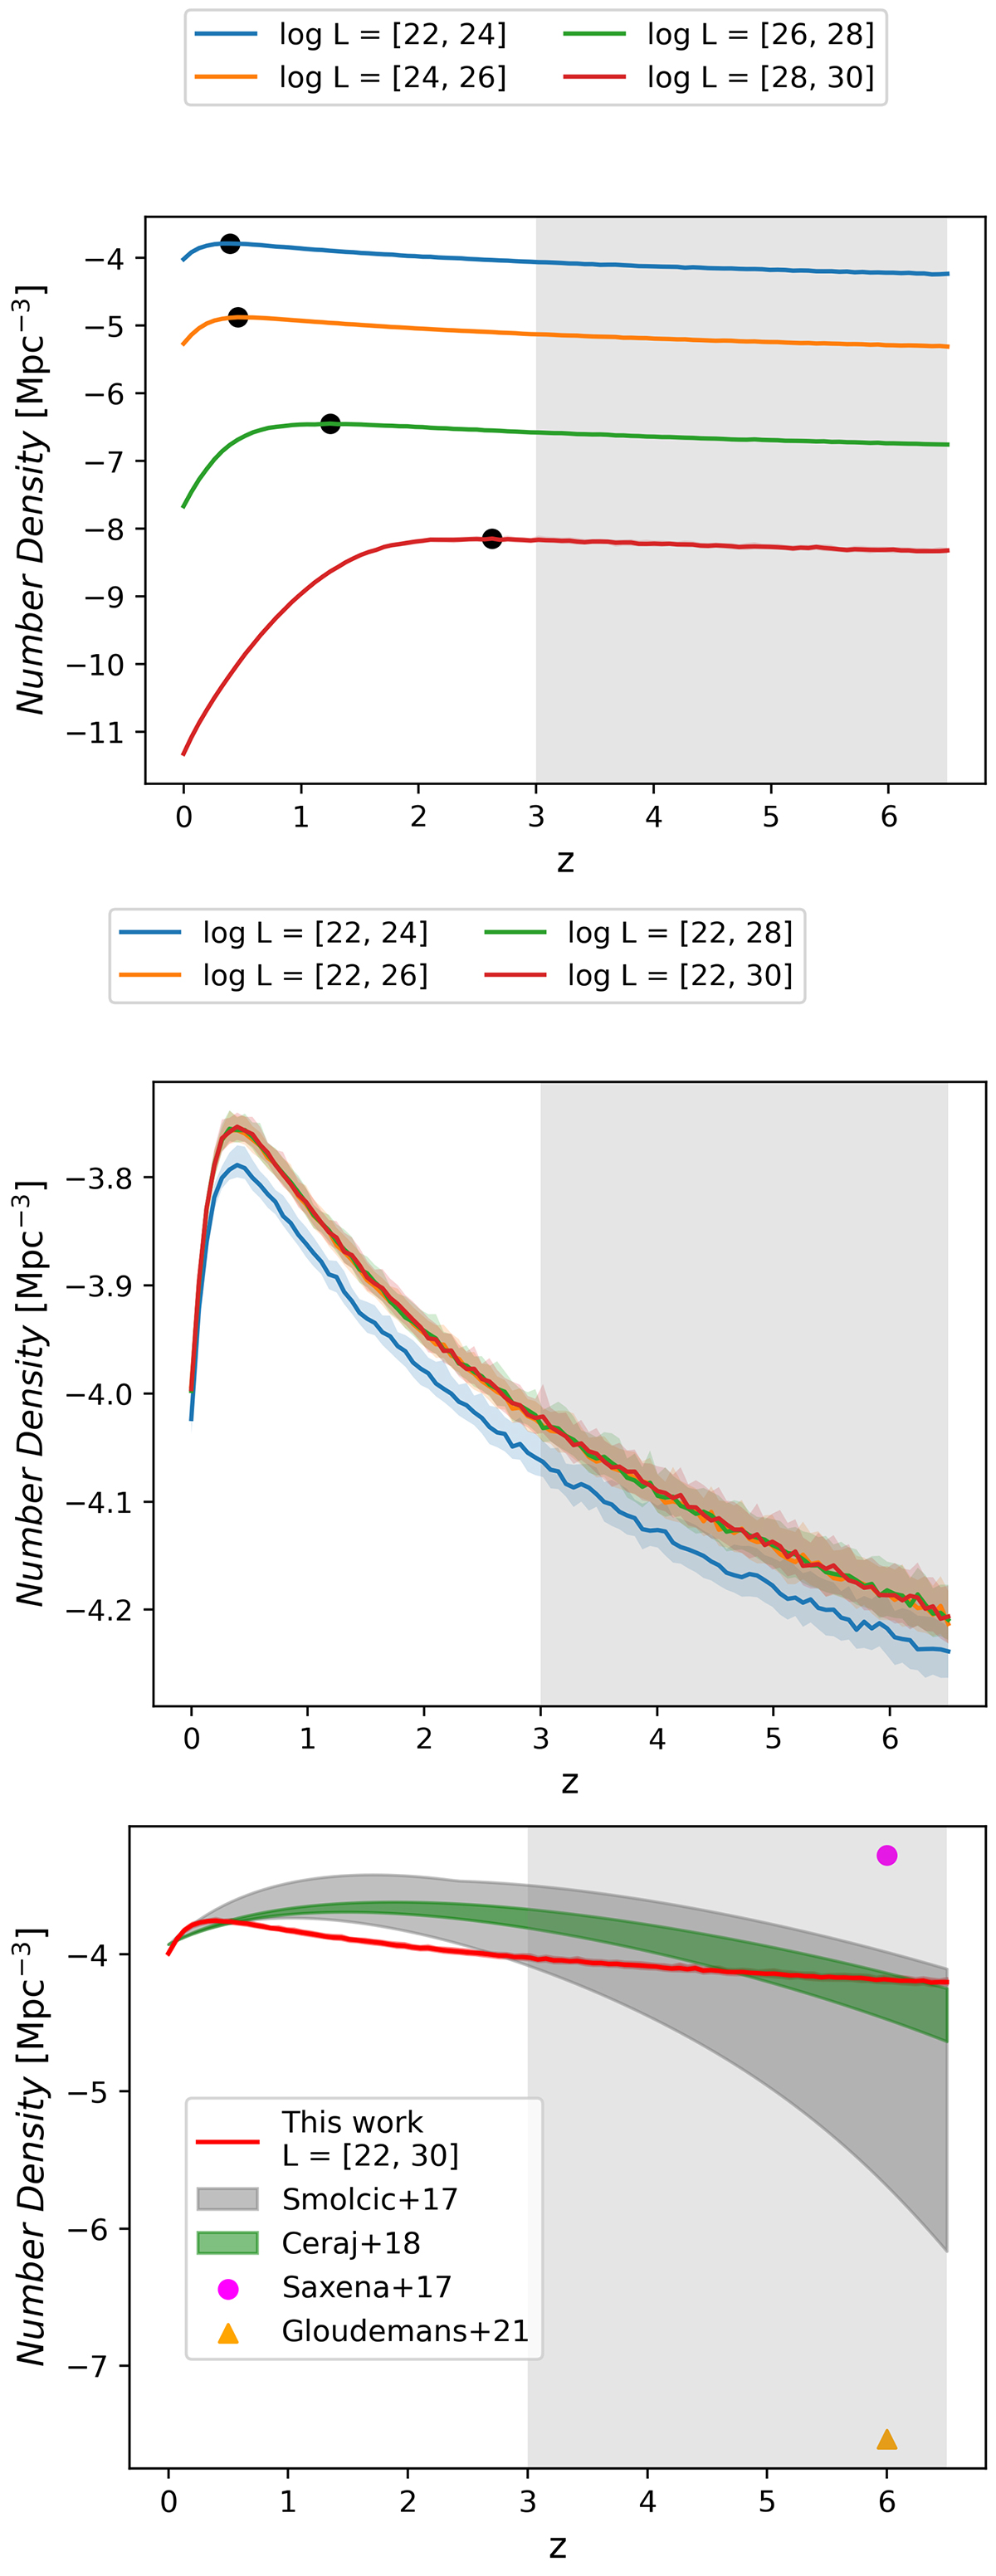
Fig. 8.
Download original image
Number density. Upper panel: number density calculated at 1.4 GHz for a set of different luminosity ranges of the same width, as denoted in the legend above the figure. The black dots represent the maximum value of each line. Middle panel: number density at 1.4 GHz calculated for a set of progressively increasing luminosity ranges, as denoted in the legend above the figure. Lower panel: number density at 1.4 GHz as a function of redshift for a set of different surveys, denoted in the legend. The data points denote the high-redshift quasar surveys as described in the text. The uncertainties in this work are calculated from the resulting samples within the parametric Bayesian method as 90% quantiles. The uncertainties of the literature values were determined as maximum uncertainties of the parameters, as described in the text. The shaded area in the plots denote a higher redshift where the LF models are less constrained. The high-redshift quasar density from Gloudemans et al. (2021) is a lower limit, as the luminosity range of the LF used in the calculation was smaller.
Current usage metrics show cumulative count of Article Views (full-text article views including HTML views, PDF and ePub downloads, according to the available data) and Abstracts Views on Vision4Press platform.
Data correspond to usage on the plateform after 2015. The current usage metrics is available 48-96 hours after online publication and is updated daily on week days.
Initial download of the metrics may take a while.