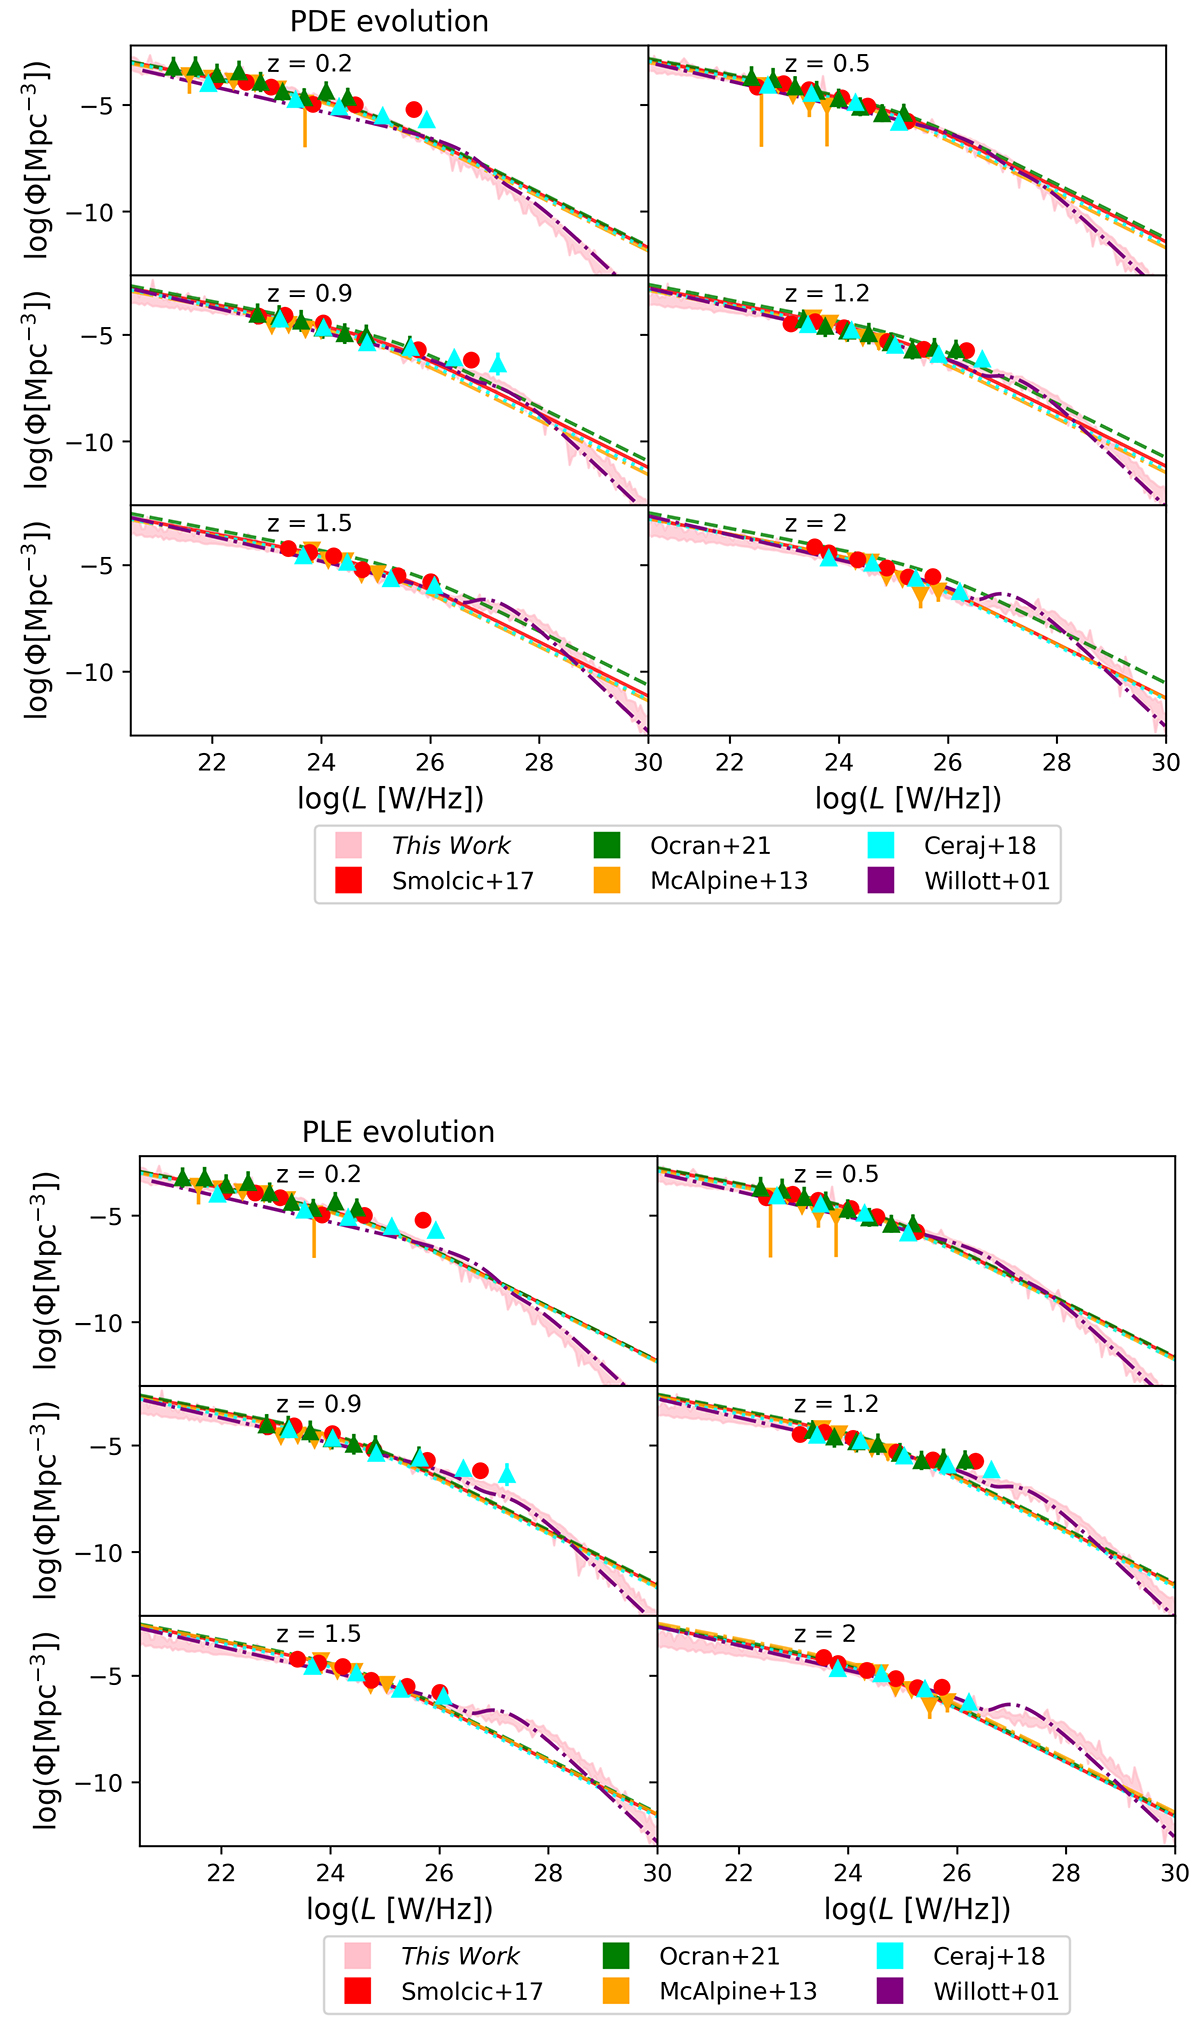
Fig. 7.
Download original image
Comparison of our LDDE model with the models from the literature, shown separately for PDE and PLE literature evolution models, as denoted above the figures. The used surveys are denoted in the legend. We also show the maximum volume data points taken from the literature in the same colour as the corresponding LF model line. The results of this work, represented by 90% quantiles are given in pink. The Willott LF shown is the one derived by Willott et al. (2001).
Current usage metrics show cumulative count of Article Views (full-text article views including HTML views, PDF and ePub downloads, according to the available data) and Abstracts Views on Vision4Press platform.
Data correspond to usage on the plateform after 2015. The current usage metrics is available 48-96 hours after online publication and is updated daily on week days.
Initial download of the metrics may take a while.