Open Access
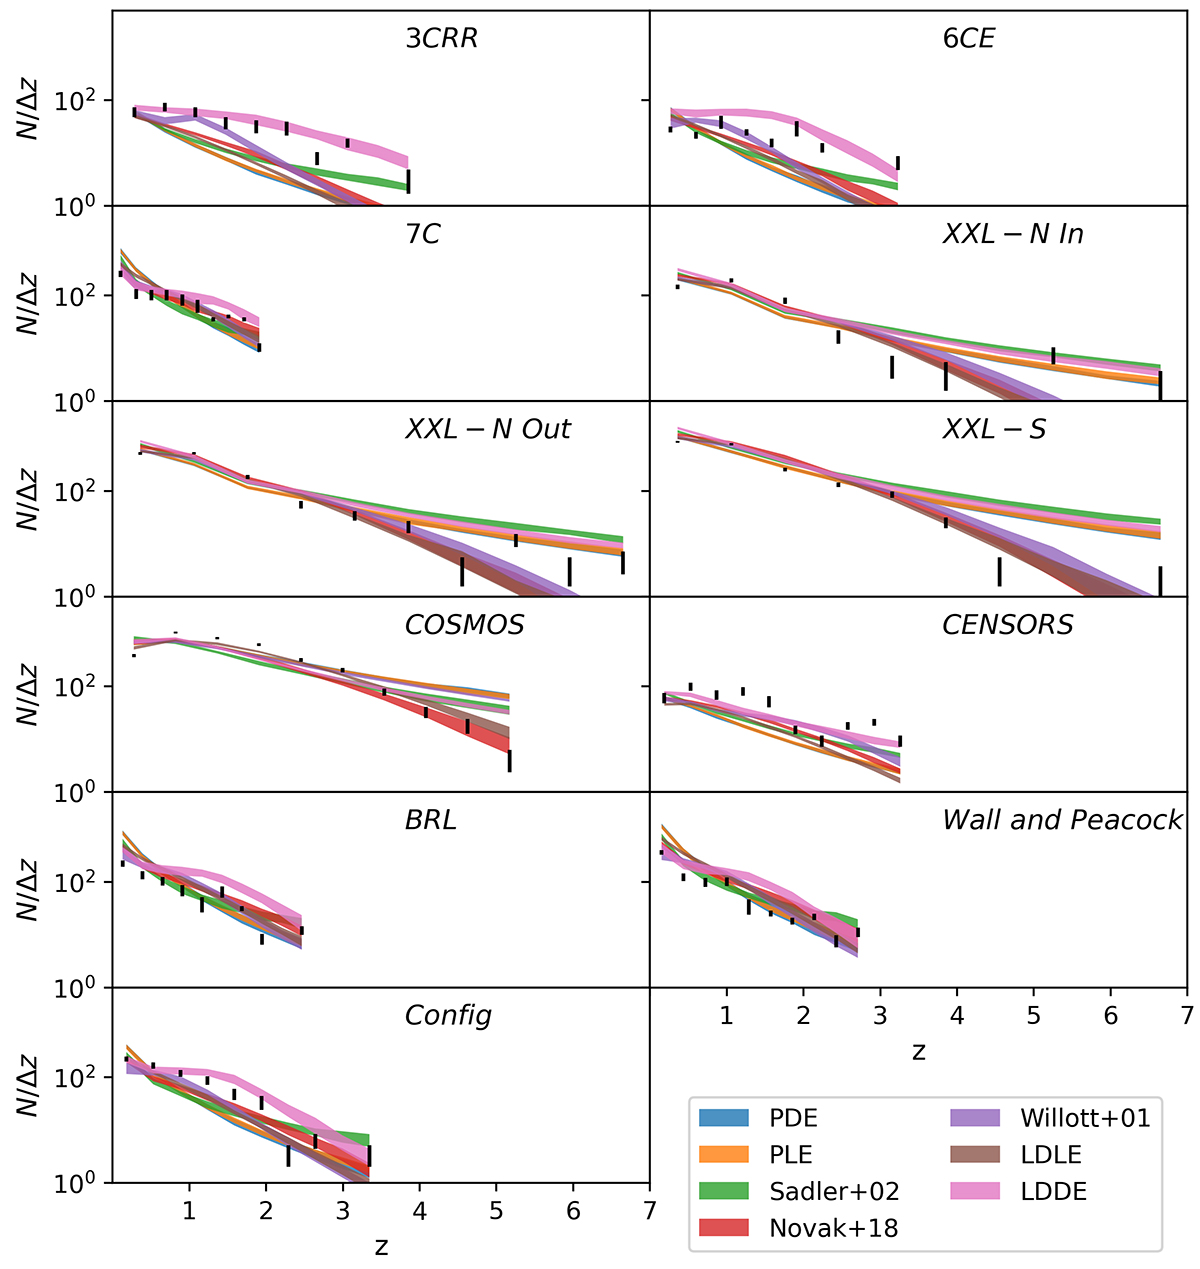
Fig. 6.
Download original image
Redshift distribution of sources shown as a number of sources divided by the width of the redshift bin. The figure shows both the observed redshift histograms as data points as well as the model prediction lines. The shaded areas are the 85% quantiles obtained by randomly drawing samples from the posterior.
Current usage metrics show cumulative count of Article Views (full-text article views including HTML views, PDF and ePub downloads, according to the available data) and Abstracts Views on Vision4Press platform.
Data correspond to usage on the plateform after 2015. The current usage metrics is available 48-96 hours after online publication and is updated daily on week days.
Initial download of the metrics may take a while.