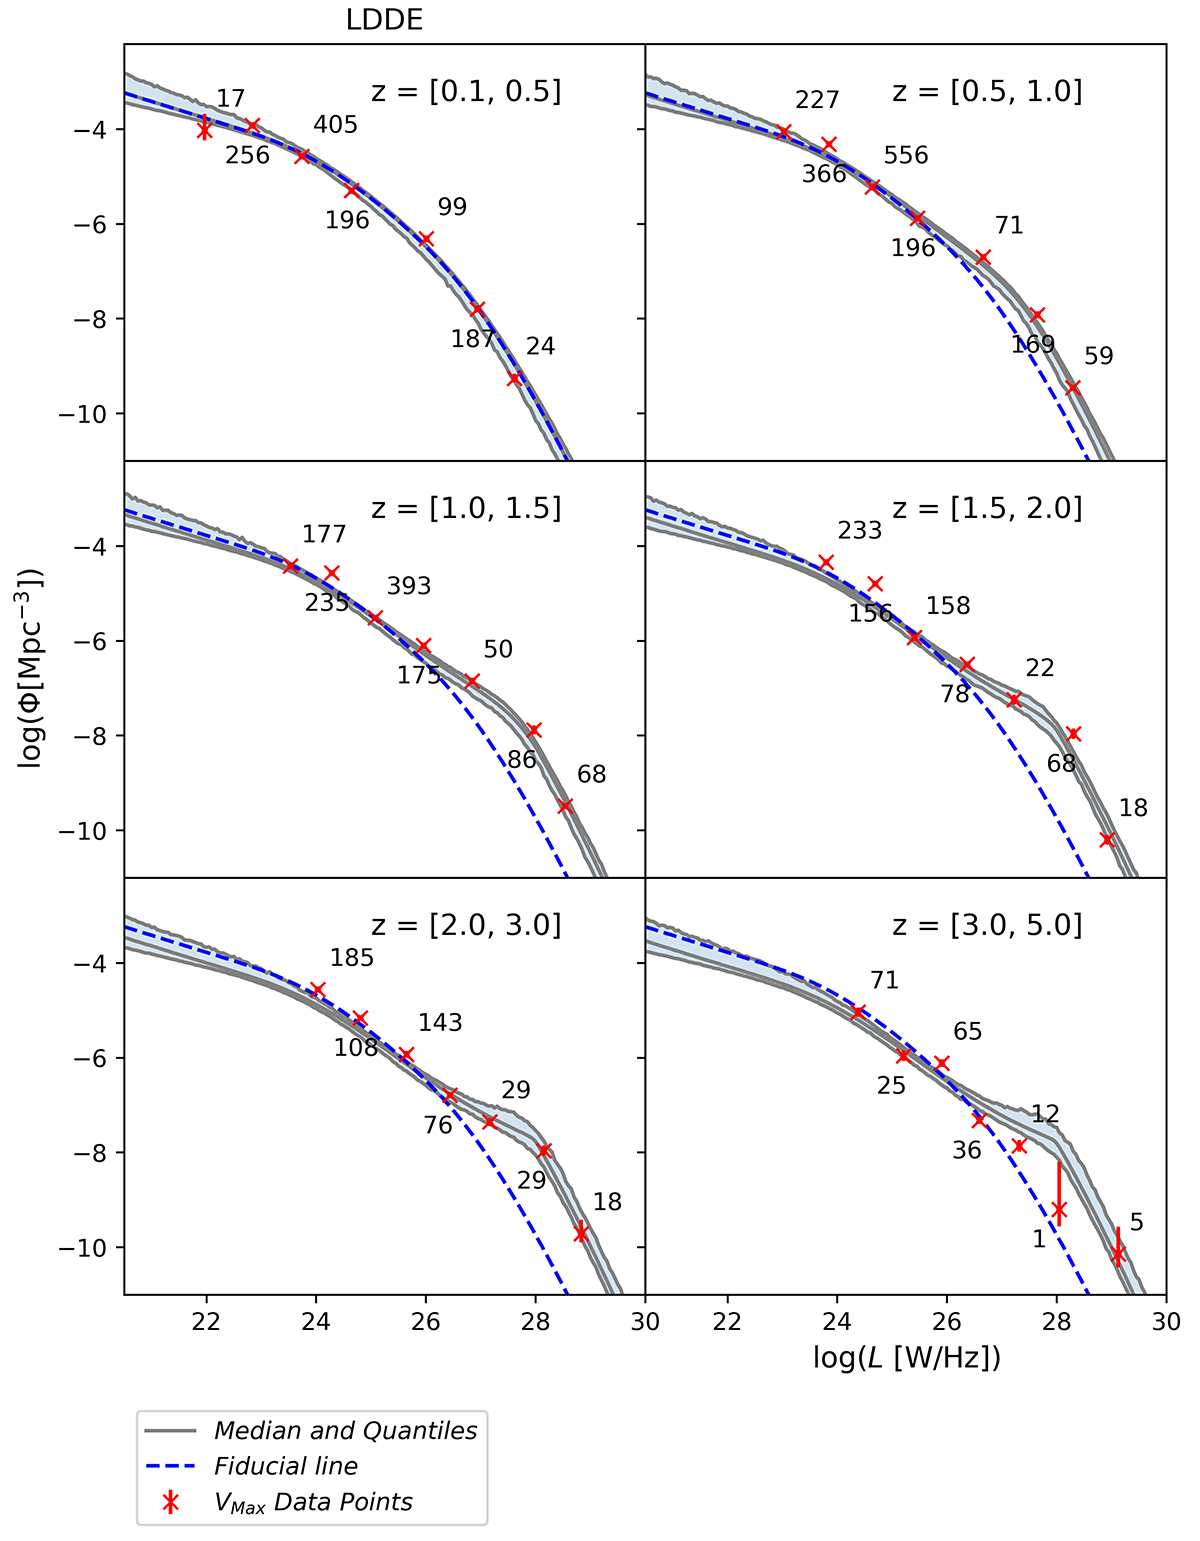
Fig. 2.

Download original image
Luminosity functions modelled using the COSMOS, XXL, 3CRR, 7C, 6CE, CENSORS, BRL, Wall & Peacock, and Config surveys and obtained by two complementary methods: Bayesian modelling and the method of maximum volumes. Grey lines denote the median and 90% quantiles of the parametric Bayesian inference. These values were obtained by randomly drawing samples from the posterior. The crosses denote the non-parametric method of maximum volumes along with the corresponding error bars. The uncertainties were derived assuming Poisson errors except when the number of sources was lower than ten. For such data points, the uncertainties were represented by tabulated errors determined by Gehrels (1986). Here, the number of sources was an effective number determined from maximum volumes, as described in Ananna et al. (2022). We also show the number of sources creating each data point. The blue dashed fiducial line denotes the LF determined in the first redshift bin.
Current usage metrics show cumulative count of Article Views (full-text article views including HTML views, PDF and ePub downloads, according to the available data) and Abstracts Views on Vision4Press platform.
Data correspond to usage on the plateform after 2015. The current usage metrics is available 48-96 hours after online publication and is updated daily on week days.
Initial download of the metrics may take a while.


