Fig. 13.
Download original image
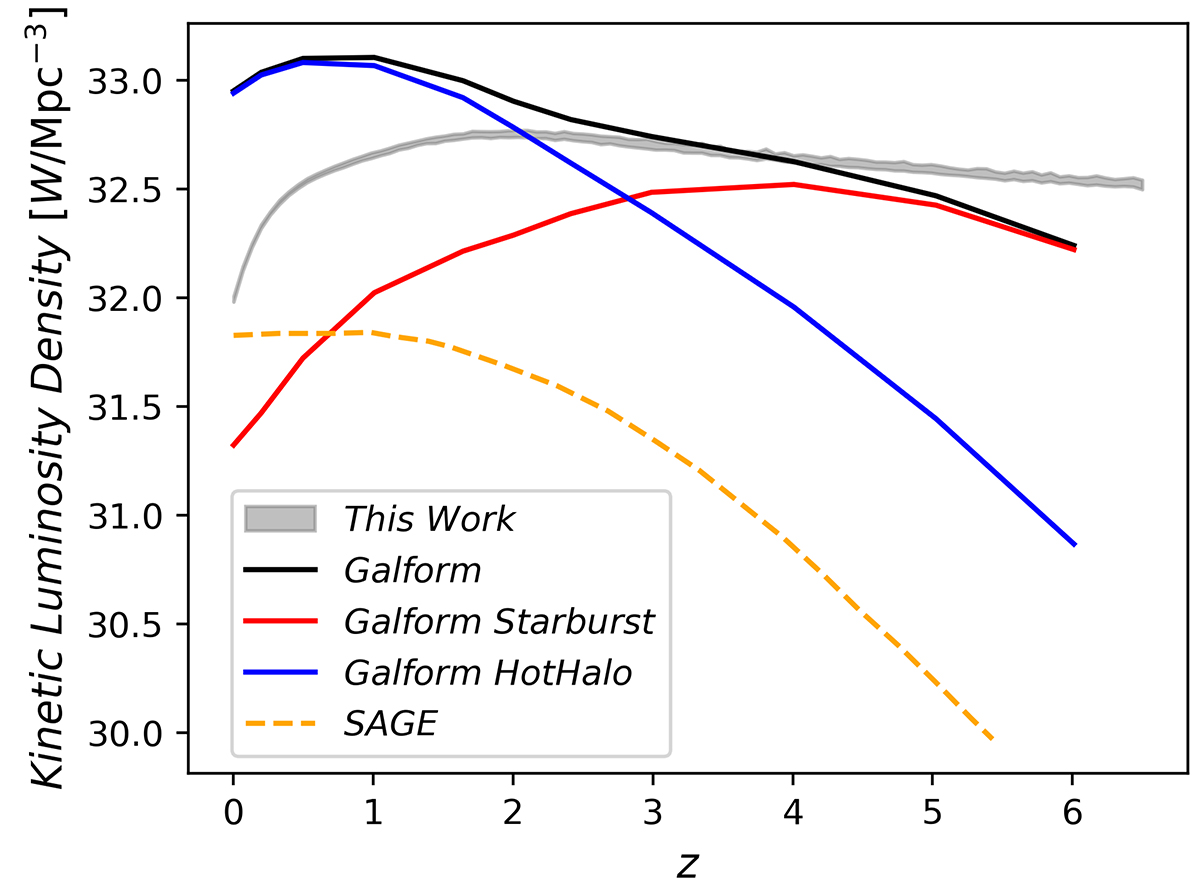
Kinetic luminosity density as a function of redshift (in grey). The uncertainties were calculated from the resulting samples of the parametric method as 90% quantiles. The black, red, and blue lines correspond to the predictions from GALFORM. The black line is the total density, while the red and blue lines denote the hot-halo and starburst modes, respectively. The orange dashed line represents the SAGE model.
Current usage metrics show cumulative count of Article Views (full-text article views including HTML views, PDF and ePub downloads, according to the available data) and Abstracts Views on Vision4Press platform.
Data correspond to usage on the plateform after 2015. The current usage metrics is available 48-96 hours after online publication and is updated daily on week days.
Initial download of the metrics may take a while.