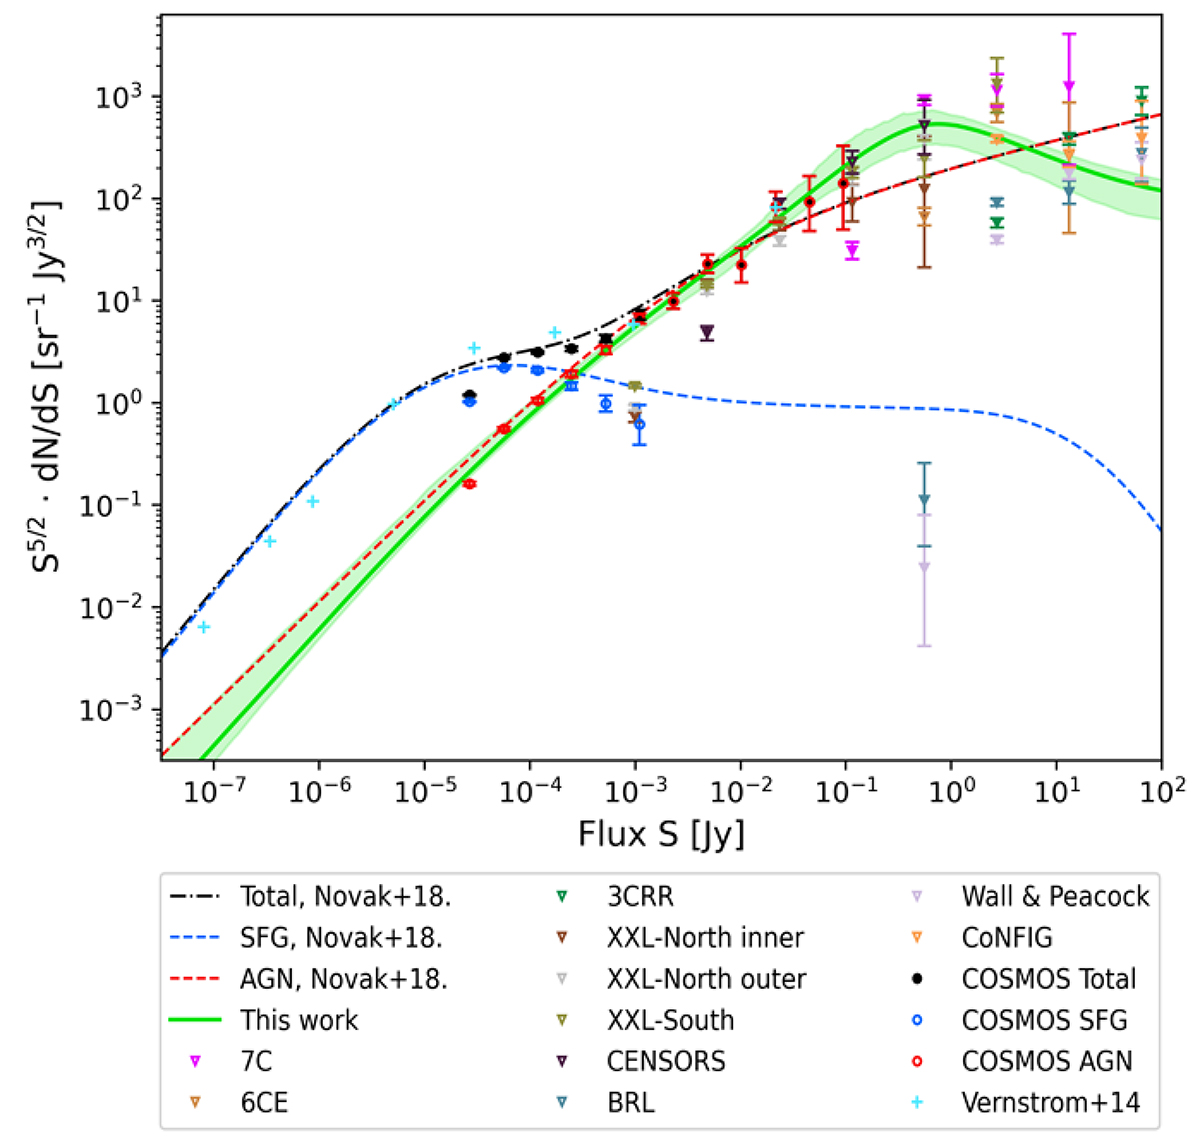
Fig. 12.
Download original image
Source counts modelled together with data points obtained directly from the catalogues. The green dashed line denotes the model obtained from LFs constrained within this work. The errors were determined by selecting 500 samples from the posterior. The red, blue, and black lines denote models from Novak et al. (2018) obtained from LFs for AGN, SFGs, and the total population, respectively. The data points represent the source counts obtained from the catalogues as denoted in the legend. The catalogues are the same as described in Sect. 2 except for the ones denoted as Vernstrom+14, which were taken from another study by Vernstrom et al. (2014). The COSMOS SFGs are sources from the COSMOS catalogue not selected by the radio excess threshold described in Sect. 2. The outlier data points are due to the finite detection limit.
Current usage metrics show cumulative count of Article Views (full-text article views including HTML views, PDF and ePub downloads, according to the available data) and Abstracts Views on Vision4Press platform.
Data correspond to usage on the plateform after 2015. The current usage metrics is available 48-96 hours after online publication and is updated daily on week days.
Initial download of the metrics may take a while.