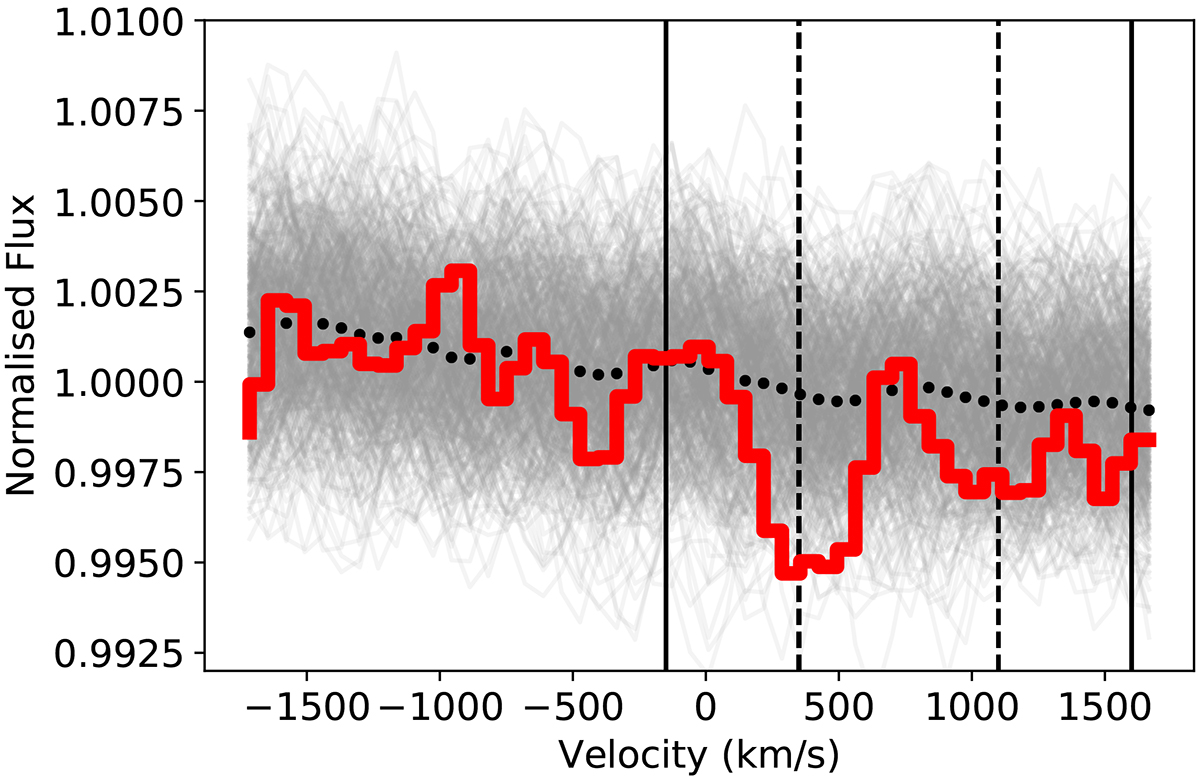
Fig. 9.
Download original image
Plot of 500 random stacks from the bootstrapping in grey. The stacks are from the same sample of 16 224 cluster–quasar pairs stacked at randomised redshifts from the full redshift distribution. The overlayed black dotted line represents the median flux per velocity bin of the 500 random stacks. On top, we over-plot in red the original blind stack from Fig. 8 to illustrate the difference.
Current usage metrics show cumulative count of Article Views (full-text article views including HTML views, PDF and ePub downloads, according to the available data) and Abstracts Views on Vision4Press platform.
Data correspond to usage on the plateform after 2015. The current usage metrics is available 48-96 hours after online publication and is updated daily on week days.
Initial download of the metrics may take a while.