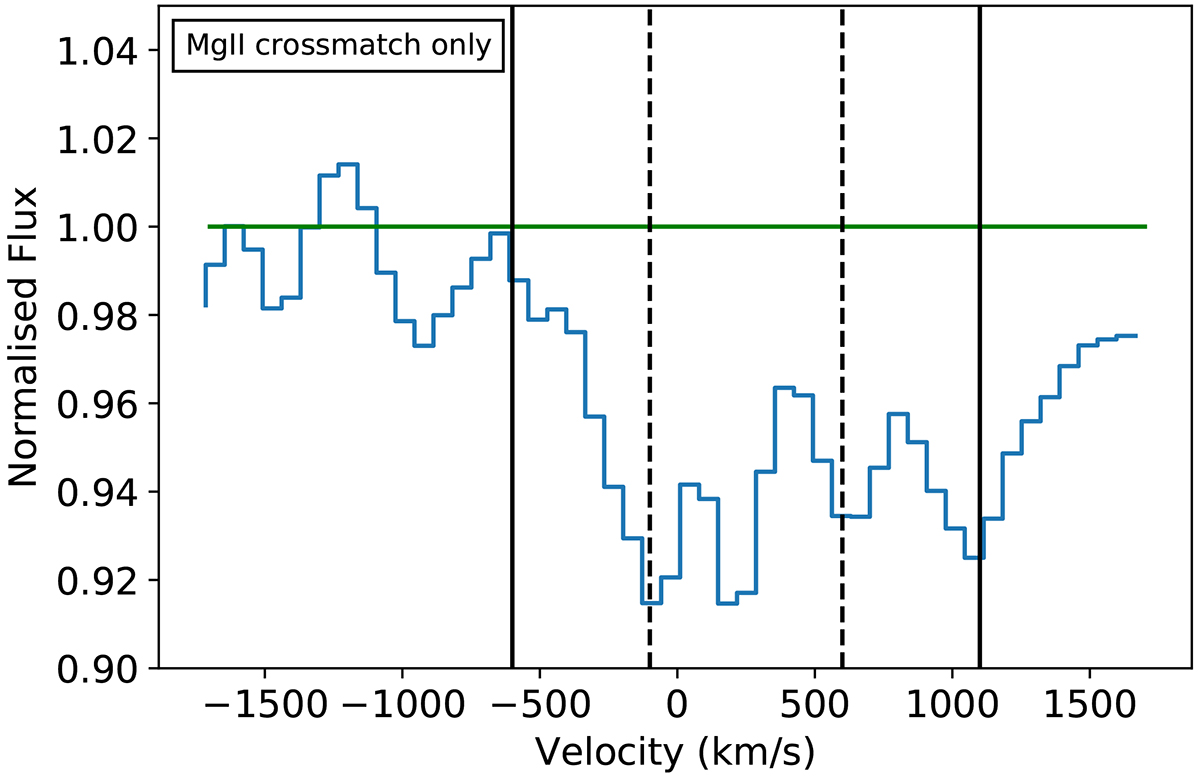
Fig. 7.
Download original image
Stack of quasar spectra with a sightline within 3 × R200 of the centre of a cluster, and with known MgII absorbers from the MgII absorption catalogue of Anand et al. (2021) satisfying |dv|< 2000 km s−1. The figures display the normalised flux in velocity space. The first dashed line at −100 km s−1 is fixed at the location of the minimum flux within [−2000:2000] km s−1 of the redshift of the known MgII absorber. The second dashed line is placed at +750 km s−1 from the first dashed line, which corresponds to the separation of the two MgII lines in the doublet. The solid vertical lines are fixed at −500 km s−1 from 2976 and +500 km s−1 from 2803 line. The green line shows the fitted continuum used for the EW measurement.
Current usage metrics show cumulative count of Article Views (full-text article views including HTML views, PDF and ePub downloads, according to the available data) and Abstracts Views on Vision4Press platform.
Data correspond to usage on the plateform after 2015. The current usage metrics is available 48-96 hours after online publication and is updated daily on week days.
Initial download of the metrics may take a while.