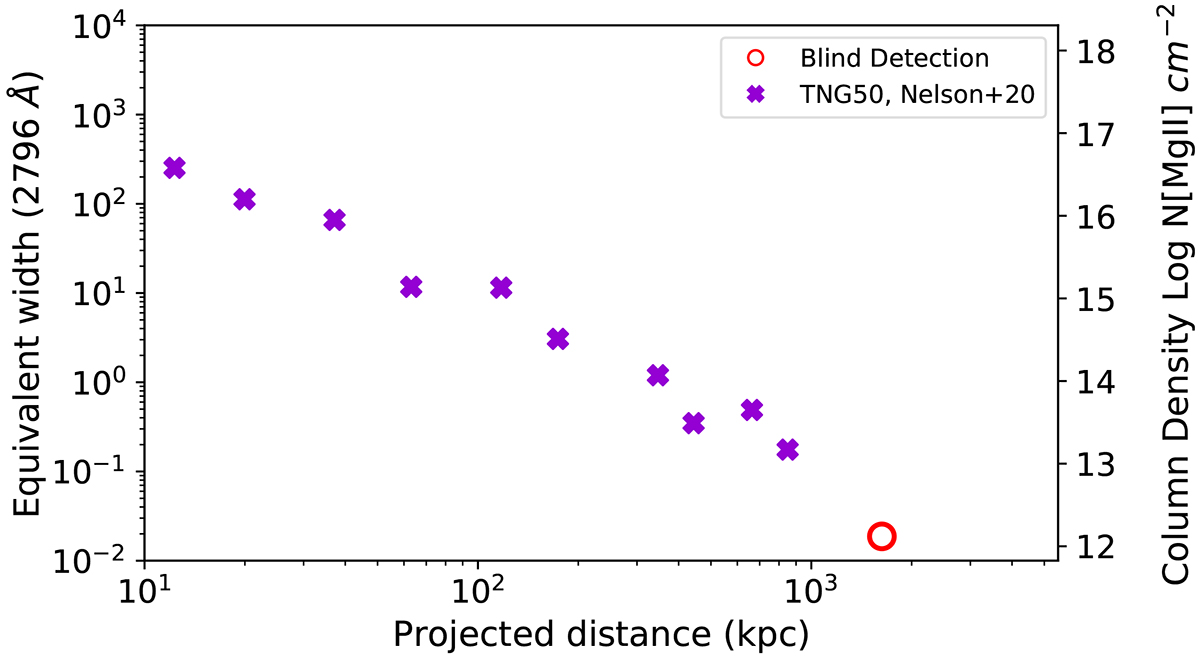
Fig. 13.
Download original image
Comparison between our blind stack with hydrodynamical cosmological simulations from TNG50 (Nelson et al. 2020). The shape and colour of the symbols are as in previous figures. The purple symbols display predictions of the MgII column density in TNG50 as a function of projected distance in kpc. We stress that there are large mass differences between the models and the data: the TNG50 highest mass bin (∼1013.5 M⊙) displayed in the figure is smaller than our smallest mass cluster (3.28 × 10¹⁴ M⊙). Considering this mass difference, we note that there is likely an excess of MgII-absorbing cold gas in the TNG50 simulations.
Current usage metrics show cumulative count of Article Views (full-text article views including HTML views, PDF and ePub downloads, according to the available data) and Abstracts Views on Vision4Press platform.
Data correspond to usage on the plateform after 2015. The current usage metrics is available 48-96 hours after online publication and is updated daily on week days.
Initial download of the metrics may take a while.