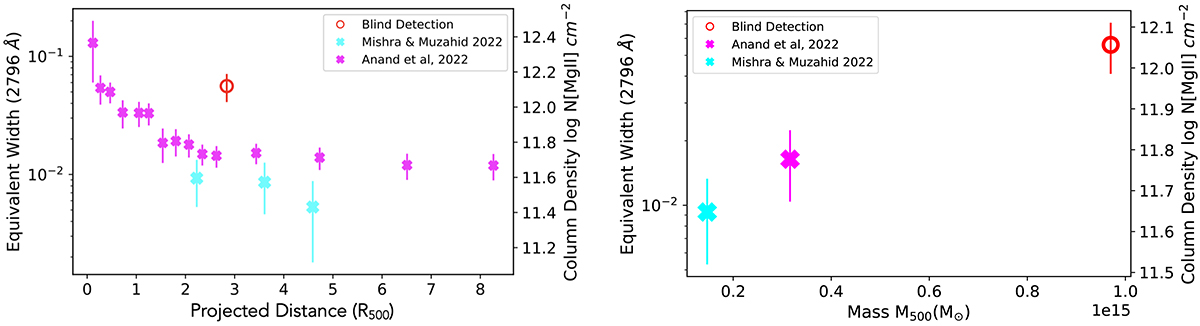
Fig. 11.
Download original image
Equivalent width and column density from the blind sample compared with results from the literature (Anand et al. 2021; Mishra & Muzahid 2022). The left panel displays the detection in the blind sample as a function of projected distance (in units of R500), with the detection in our blind stack depicted as a red circle. In the right panel, we plot the mean of the two points of Anand et al. (2021) and the point of Mishra & Muzahid (2022) closest to our results in projected distance space (see left panel). This second figure highlights the difference in mass range between the samples.
Current usage metrics show cumulative count of Article Views (full-text article views including HTML views, PDF and ePub downloads, according to the available data) and Abstracts Views on Vision4Press platform.
Data correspond to usage on the plateform after 2015. The current usage metrics is available 48-96 hours after online publication and is updated daily on week days.
Initial download of the metrics may take a while.