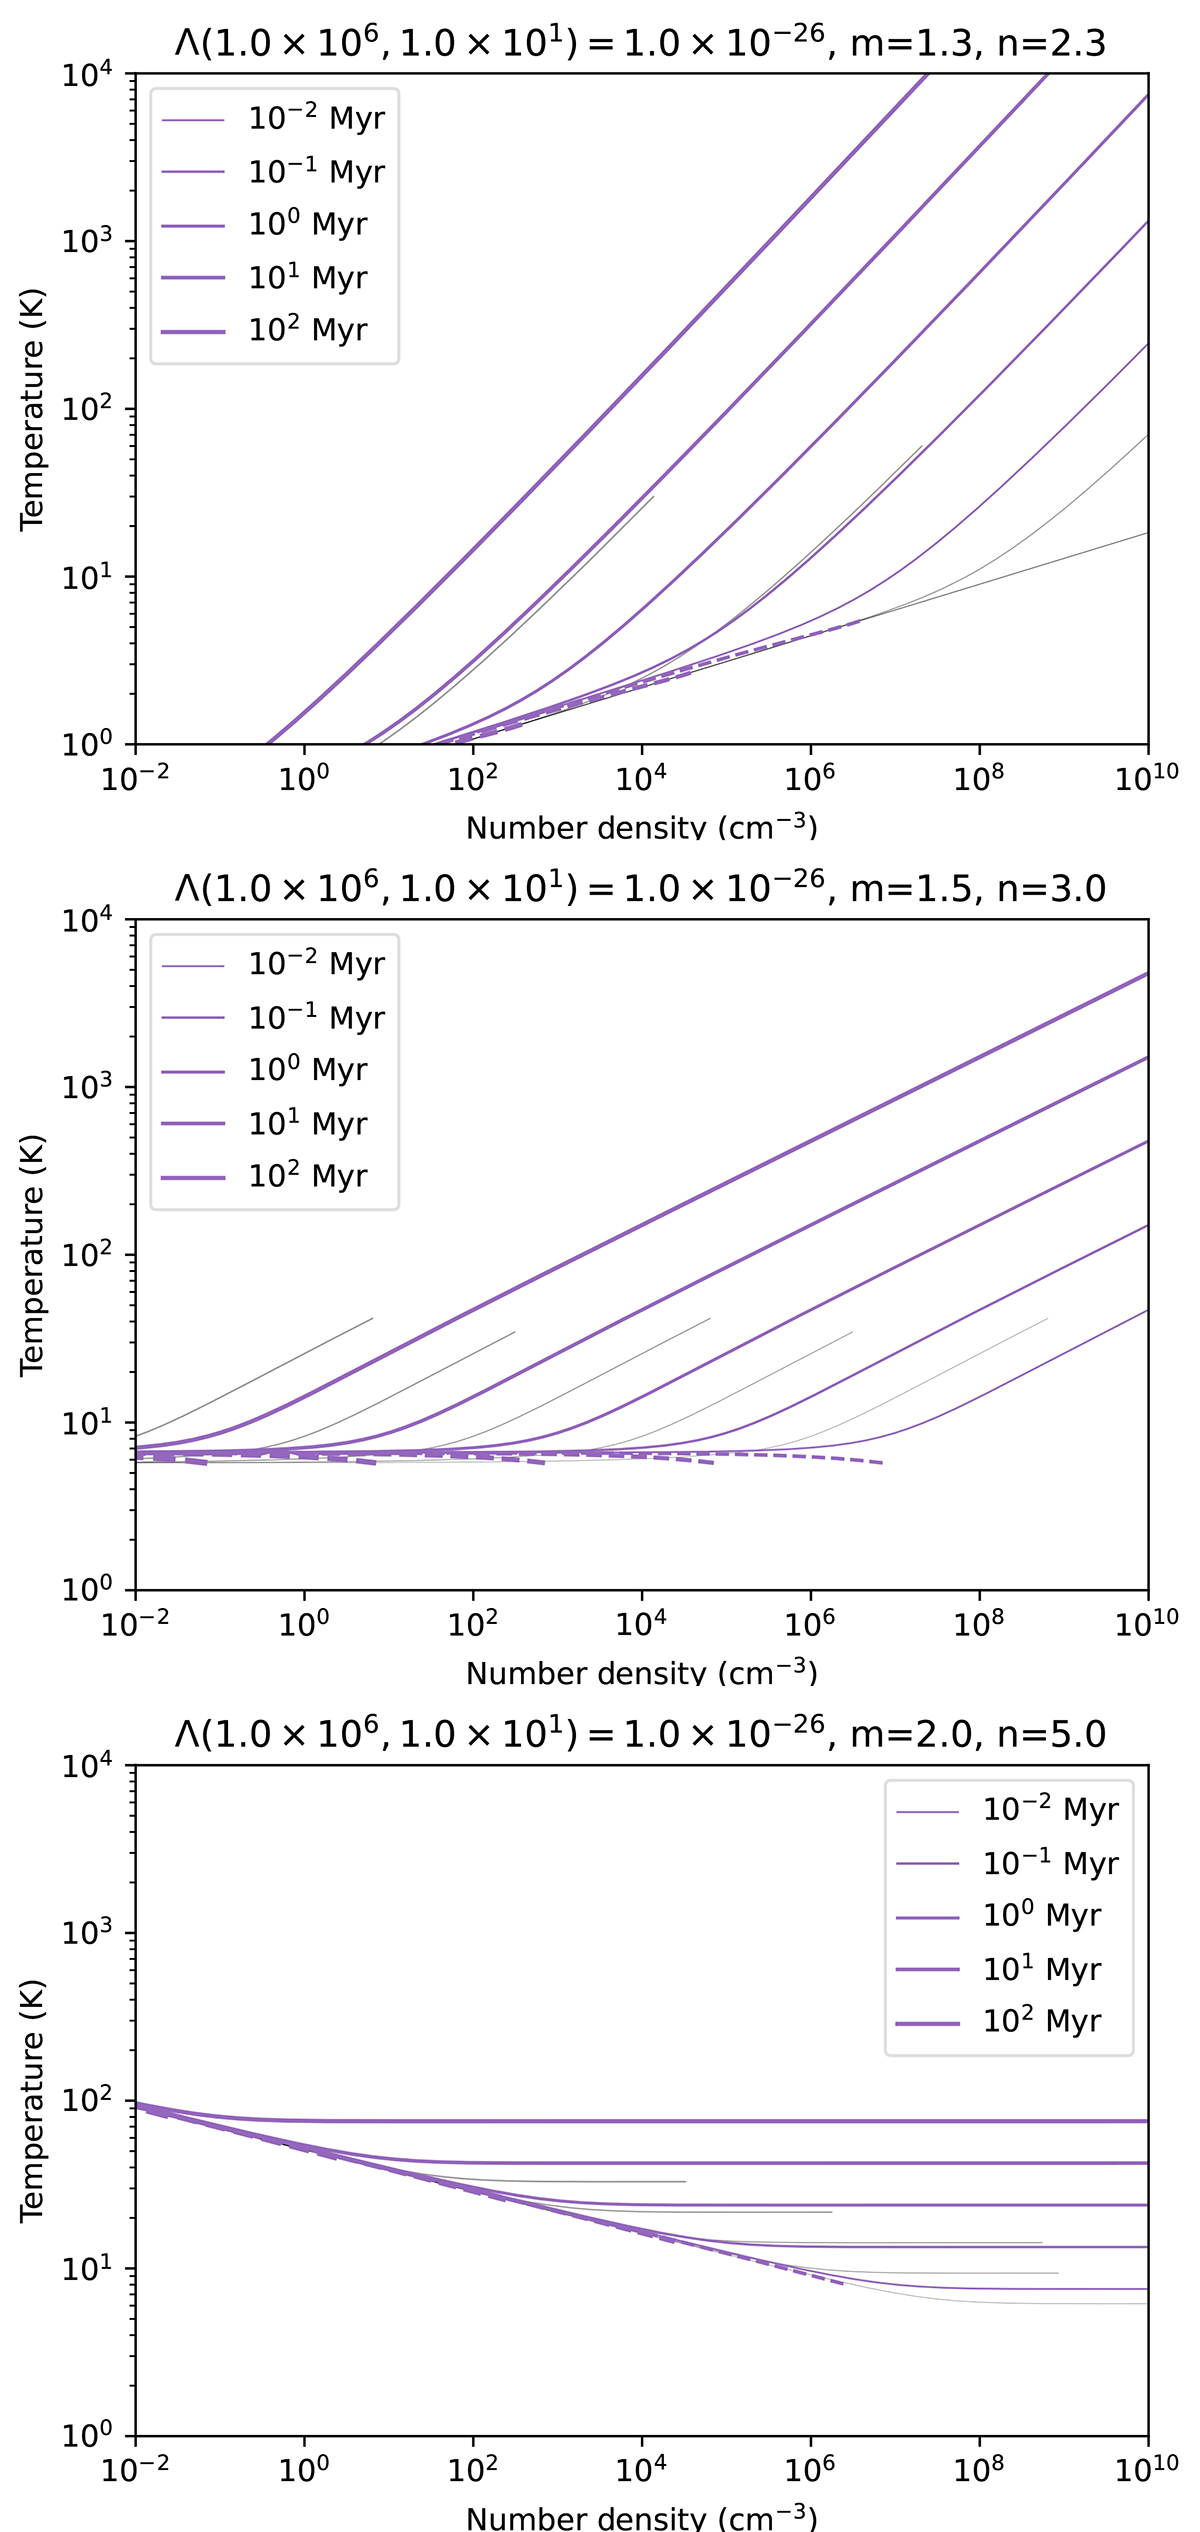
Fig. 6.
Download original image
Temperature–density relation snapshots of the three example cases shown in Figs. 4, E.1, and E.2. Solutions for t < 0 and t > 0 are presented with dashed and solid lines, respectively. The colored lines with increasing thickness correspond to increasing absolute time. The gray curves with increasing thickness trace the time evolution of fluid parcels at enclosed mass coordinate M = 1, 10, 100, 1000, 10 000 M⊙.
Current usage metrics show cumulative count of Article Views (full-text article views including HTML views, PDF and ePub downloads, according to the available data) and Abstracts Views on Vision4Press platform.
Data correspond to usage on the plateform after 2015. The current usage metrics is available 48-96 hours after online publication and is updated daily on week days.
Initial download of the metrics may take a while.